Original Link: https://www.anandtech.com/show/1902
Investigations into Athlon X2 Overclocking
by Jarred Walton on December 21, 2005 12:00 PM EST- Posted in
- CPUs
Introduction
Note: This is the second article in a series of overclocking articles. Our first article looked at overclocking a Venice 3200+ chip using two different types of RAM, and it laid the groundwork for what we're doing in this article. We've updated some of our component choices as well as our benchmarks. The major difference is that we're now using an X2 3800+ for the processor, and we also upgraded to a 7800 GTX graphics card. We'll be looking at performance with several types of RAM as well. These articles are not targeted at the advanced overclockers, nor are we going for extreme performance at any cost. The main objective is to use some cost-effective setups and show what sort of performance level can be achieved.
As we mentioned before, there is a risk in overclocking and we do not recommend it for everyone. A system that appears stable for weeks or even months can suddenly have problems, so we definitely wouldn't recommend overclocking for casual computer users who may not be able to recognize or deal with such issues. We take no responsibility for any difficulties or losses that you may experience by using the information in this article, and we certainly take no responsibility for any damage that may occur to any person, place, or object. The risk is yours alone, and a little bit of caution won't hurt. Since we are only using a small subset of parts from the available options, this is merely intended as a baseline performance measurement. Finally, there is no such thing as a "guaranteed result"; you may or may not match the results that we achieve.
We started our recent look at overclocking platforms with the Venice 3000+ and 3200+ processors. Using a $130-$180 processor, we showed that it was possible to come near the performance offered by the extremely fast and extremely expensive FX-57. Actually, we came closer to FX-55 performance, but for about 1/6 the price, that’s still very impressive. Having looked at the Venice core, the next worthwhile upgrade to the processor has to be the move to dual cores. The change also comes with a major increase in price, unfortunately, and depending on the task, it may or may not matter. Current games show no benefit from multiple cores, so unless you plan on running some other CPU intensive tasks in the background while gaming, the upgrade may not be worthwhile.
We’re looking at the Athlon X2 3800+, as you can probably already guess. However, we started work on the benchmarks quite a while back and there are actually a couple of newer options that are potentially higher performing. The new Opteron 165/170 chips use the Denmark core, which is basically the workstation version of the Toledo. While the 165 comes with a lower default clock speed, we would venture to say that it has the potential to overclock just as high as the X2 3800+ that we’ll be using in this article, and likely even higher. (The reasoning stems from the way CPUs are binned and tested. Workstation/server parts undergo much more rigorous validation processes, and typically, this means that the parts have more overclocking headroom. Most server chips are rated extremely conservatively, as component failure is far more undesirable – and uncommon – than in desktop computers.) Combined with the increased L2 cache, you potentially end up increasing performance without spending any more money.
Rather than abandoning all of the benchmarks that we’ve already run, though, we’re going to present the results along with some commentary on the overall experience of overclocking the Manchester core. Also note that retail supplies of the Opteron DC parts may dry up in the near future. So, while we have confidence that the X2 3800+ will be available for purchase six months from now, we can't say the same of the Opteron 165.
Our last article contained a massive amount of introductory material, covering the various components that you need to consider when building a system designed for overclocking. We can safely skip all that this time, though newcomers might find it helpful to review the material. Most of our setup remains unchanged, but let’s explain that in more detail.
System Configuration
Since we're only looking at one CPU this time, we added and changed the memory options a bit. Last time, we looked at using value RAM vs. performance RAM based on Samsung TCCD memory. OCZ has moved from the old Rev2 Platinum to their new EL Platinum rated to PC-4800 speeds, and the older Rev2 platinum is no longer being manufactured. We're also adding in some results using OCZ VX Gold, Patriot 2x1GB, and we'll try to run some tests using 4x512MB of the OCZ EL Platinum. The VX RAM will be somewhat limited in performance by the maximum 3.2V that the DFI Infinity provides, but it will also serve as a reference point for tighter timings and lower bandwidth in comparison to the PC-4800 RAM.
Along with the more expensive CPU, we felt that it only made sense to upgrade the graphics card, so we're running with a GeForce 7800 GTX - an XFX model with default 450/1200 clock speeds. Note that for games, the results from the Venice processor will basically match the results that we would achieve with the Manchester, so you can refer to the earlier article to see how this system would perform in games with an X800 Pro. The reverse is also true; if you're only running games without any background tasks, the results here (in games) will show how well the Venice setup should perform with a more expensive graphics card. Here's the complete list of components used.
| AMD Overclocking System | |
| Hardware | Component |
| Processor | Athlon 64 X2 3800+ Manchester 2x512K 2.0GHz (OEM) |
| Heat Sink/Fan | Thermalright XP-90 with generic 92mm 3000 RPM fan |
| Motherboard | DFI nF4 INFINITY nForce4 AMD 6.70 drivers |
| Memory | Patriot/PDP 2x1024MB ELL 2-3-2-5-1T OCZ EL Platinum PC4800 2-2-2-5-1T/2.5-4-4-7-1T OCZ Gold VX 2x512MB 2-2-2-8-1T@3.2V Generic PC3200 2x512MB 2.5-3-3-8-1T |
| Video Card | XFX 7800 GTX (450/1250 clocks) ForceWare 81.95 drivers |
| Hard Drive | Seagate SATA 250GB 7200RPM 8MB 7200.8 |
| Optical Drive | NEC 3540A |
| Case | Antec Performance II SX635BII (2x80mm Vantec Stealth fans installed) |
| Power Supply | OCZ PowerStream 600W |
A complete set of benchmarks for a given configuration requires around 6-8 hours to complete, provided that nothing crashes. Unfortunately, crashes are an all-too-common occurrence when overclocking. A few driver updates (in order to run FEAR optimally) also invalidated earlier results. There are many, many factors that were not fully examined due to time constraints. This is not meant to be a fully comprehensive treatise on overclocking the X2 3800+ or any other processor. Different motherboards are certainly viable - in fact, quite a few motherboards should actually overclock better than the DFI Infinity that was used. This is really intended as a look at performance scaling, as well as some information for those looking to get the best bang for the buck. Building a faster system should be quite easy, but building a system with better performance per dollar (using a dual core processor) will be much more difficult.
I was also contacted by Asetek about testing out their MicroChill and WaterChill cooling solutions. This seemed like an appropriate place to add those to the list of benchmarked configurations, but they really deserve a separate review, so look for that in the very near future. Besides, article bloat and readability can be a problem.
Benchmark Information
System components aren't the only changes that we've made. We eventually discovered an error in our Battlefield 2 benchmark last time and removed the scores. The problem was that frame rates were tracked while in the menu screen, skewing the results. We've corrected the benchmark and will provide complete results this time, and we also switched to version 1.03 of BF2 rather than using 1.00. (We'll be switching again to a new demo and version 1.12 soon. Wouldn't it be nice if game updates didn't break old demos?) In addition, Quake 4 and FEAR are now part of the game list. Quake 4 and Doom 3 are very similar, though we did notice that Quake 4 timedemo benchmarks actually disable some of the extra graphical effects (like some of the shadows and lighting).
Here's the list of all the benchmarks that were run, along with information on how they were run:
| Benchmark Information | |
| Winstones 2004 (v1.01) | Default settings except reboots between benchmark runs were disabled. |
| PCMark04/05 | Default settings. |
| AutoGK 1.96 | Encode Ch. 9 of The Sum of All Fears to 75% quality Encode a 30 second commercial to 5MB size with audio DivX version 5.2.1 and Xvid version 1.0.3 |
| Battlefield 2 (v1.03) | High detail setting with lighting set to High as well. |
| Doom 3 (v1.03) | High detail setting. |
| Quake 4 (v1.00) | High detail setting. |
| Far Cry (v1.33) | Very High setting with 8xAF. |
| Half-Life 2 | All settings at High plus Reflect World and 8xAF. |
| F.E.A.R. (v1.01) | High detail setting with 8xAF and no soft shadows. |
| 3DMark03/05 | Default settings. |
| CPU-Z (v1.30) Latency.exe | CPU cycles using 512 byte stride size with 32M data set. |
Please pay attention to the scales used on the graphs. The numbers are also included for reference, and in order to avoid having all of the results overlap, the charts for the most part do not start at the 0 point. This was not done to obfuscate the results, but rather to make the charts less cluttered. A steep line slope will not indicate a significantly faster score in most cases.
Battlefield 2 Benchmark Utility
We received some requests for our BF2 benchmark utility, and since I created it, I'm going to provide it for download here. First, a quick disclaimer: Battlefield 2 benchmarking is a little odd. The built-in benchmark feature runs the demo and pops up a modal dialog at the end with the results - except that you can't see the results because BF2 is still running fullscreen. Pressing space will clear the dialog and allow the game to exit, at which time you can open the results file. The problem is that the results file shows the average frame rate skewed by the menu - the menu will often render at hundreds of frames per second! The timedemo_frametimes.csv file contains the time used for every frame rendered, though, and we know the exact number of frames in our demo file: 6362. By only using the time required to render the last 6362 frames from the CSV, we can calculate the real FPS.
The benchmark takes care of all of this for you, but it's still beta software. Sometimes BF2 will crash and the script will get stuck in a loop; in which case, you'll have to close the command prompt window (or press CTRL+C). Also, some editing of the batch file will generally be required in order to customize the options. Specifically you should set the resolutions that you want to test as well as the drive and directory where BF2 is installed. Don't select resolutions that your monitor can't support - BF2 will simply exit and the script will be stuck in a loop. SLI support also appears to be questionable, at least with the tested versions of NVIDIA's drivers and BF2 1.03.
With the disclaimers done, here's the benchmark tool - including the bf2demo and bf2cam files. Extract it to your C: drive (C:\BF2Bench) and it should work with only a few edits. If you want to extract it elsewhere, you will need to edit the batch file a bit more, but it should still work. Included are freeware versions of a few helper utilities that are required for the script to work. Sleep.exe is used to wait (without using CPU resources) for the benchmark to complete. Gawk.exe is used to calculate the actual FPS for the demo, as well as the amount of time required to load the level. (If you haven't heard of GAWK or AWK before, it is an interpreted programming language of sorts that specializes in the parsing of data files and the generating or reports.)
The repeated calls to sleep.exe may affect BF2 performance slightly (more or less depending on numerous factors), so scores should only be compared with results obtained in the same manner. Suggestions for change and comments are, of course, welcome. You may also edit and/or redistribute the script, provided that my name as well as AnandTech is not removed. If you wish to compare scores with our current and previous results, you must test with BF2 version 1.03. I have also created a new version of the script (and a new demo recording) for BF2 1.12, but results in this article are from the old version. The latest patch also made benchmarking a bit easier, so the new script doesn't have to be as complex. It still has to calculate manually the frames per second in order to avoid the impact of rendering the menu screens, and the new demo file is 8336 frames long. Enjoy!
System Settings
One of the key factors for a successful overclock is choosing memory timings and speeds that will work. It is also necessary to tweak the HyperTransport speed and multiplier. We took screenshots in CPU-Z showing the CPU and Memory tabs, which will give some details on each configuration that we benchmarked. The images from CPU-Z are available in a single Zip file (1 MB) if you want to see them (they will not be shown elsewhere in this article).
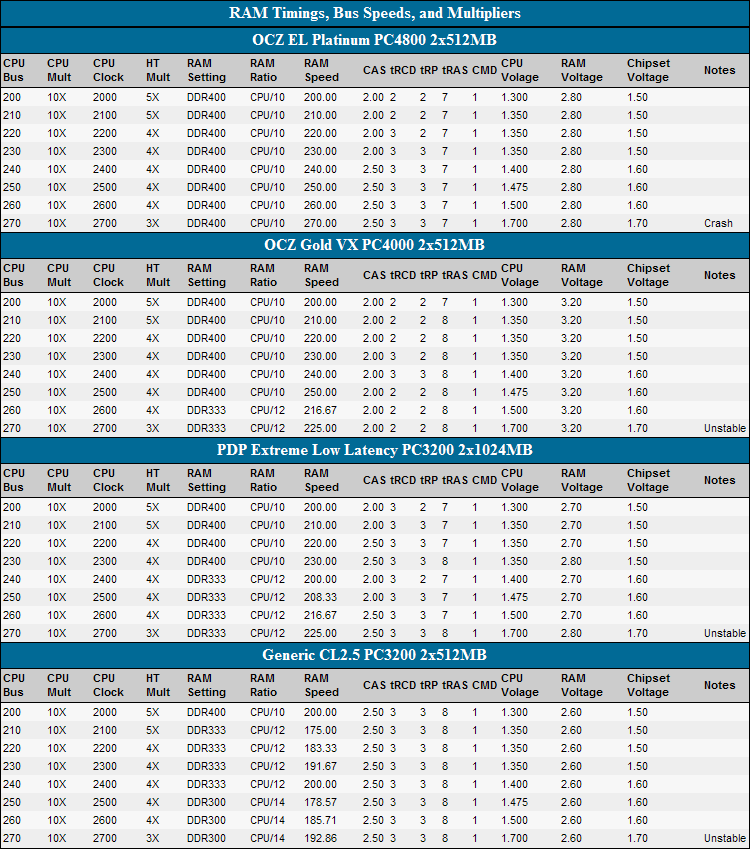
Most of the changes that we made in the BIOS are pretty simple, and while DFI provided the option to tune many memory timings, we stuck with the options that are available on the majority of enthusiast motherboards. We modified multipliers, RAM ratios, voltages, and the standard memory timings: CL, tRCD, tRP, tRAS, and CMD. All other memory timings were left at Auto. If you have a motherboard that doesn't support the same settings that we used, you will need to use some trial and error to discover the optimal settings for your board.
Click to enlarge.
Note how CPU voltages scaled rapidly as we neared the highest overclock levels. We did spend more time checking out voltages for this article, and unless a configuration could run through both 3DMark and both PCMark tests in sequence without crashing, we did not consider the voltage stable. We increased the voltage in 0.025V increments until the Futuremark tests all ran to completion.
While the Venice chip that we tested was fully stable at 2.7 GHz and slightly flaky at 2.8 GHz, the Manchester core that we used was slightly less capable. 2.6 GHz presented no problems at all during testing, and we ran Prime95, SuperPi, Folding@Home, and many games with the system running at 2.6 GHz without any crashes. 2.7 GHz was a different story, with periodic crashes in several games, particularly after an extended period of time. Prime95 and Folding@Home also experienced problems with the 2.7 GHz clock speed, though SuperPi still managed to calculate 32M decimals simultaneously on both cores. Other X2 chips may perform substantially better, or possibly worse, and better CPU cooling may provide a solution. (We've heard of some 2.8+ GHz overclocks - we could barely get into Windows at 2.8 GHz, and even sitting idle the PC would still crash.)
Again, this article presents results merely as a guideline, and depending on the components used, you will almost certainly need to change a number of settings in the BIOS. A crash in many ways is the best result possible - it means that you are definitely unstable. While passing the entire benchmark suite suggests that a system is stable, there is still no guarantee that a future application won't cause problems.
RAM timings and speed are the other items that we changed quite a bit. We kept the value RAM at a constant 2.5-3-3-7-1T 2.6V setting while adjusting the ratio to keep the speed at or below DDR400. The PC-4800 RAM only required minor adjustments to reach up to DDR-540, and we left the voltage at a constant 2.8V (2.75V was the BIOS reading - the RAM voltage setting was always around 0.05V higher than the measured value). Voltage for the VX was the maximum 3.2V that the motherboard could supply, and even then, it was insufficient at higher bandwidths to allow 2-2-2-7-1T timings. Something like a DFI LanParty should be able to achieve even better timings at overclocked settings with a 3.5 V setting, though OCZ VX and Mushkin Redline are becoming difficult to find, so perhaps it's a moot point. Finally, the Patriot 2GB sticks were good for up to DDR-480 speeds, give or take, with 2.5-3-3-8-1T timings. 2.7V appeared to provide the best results, with 2.8V perhaps helping slightly at the highest RAM speeds. The PDP RAM was able to remain slightly ahead of the value RAM in terms of timings and speed, while of course offering twice as much RAM.
One area where we experienced serious problems was in running with four DIMMs. First, as expected, a 2T command rate was required. Even then, using four OCZ EL Platinum DIMMs, we were only able to complete benchmarks at 2-3-2-7-2T timings (2.8V) at default CPU clock speed. All attempts to get the system to run stable in any overclocked state of 2200 MHz or more met with failure. Winstones could run successfully in almost every instance, including 2.5-4-4-8-2T timings at 2700 MHz, but Battlefield 2, Far Cry, and FEAR all crashed (hard-locked the PC) repeatedly. Test #5 in MemTest86 also failed with display corruption. Attempts to tune the RAM better met with limited success. By changing the EQ Drive Strength to "Weak", we were able to get further in testing, but nothing was truly stable. We would venture to say that the RAM is not to blame, as both pairs of DIMMs worked separately. The most likely culprits are the motherboard and BIOS, which are not as highly tuned as many enthusiast motherboards.
A last comment is that we didn't fully benchmark all of the settings listed in the charts. We tested 2000, 2200, 2400, 2600, and 2700 MHz. In order to provide a linear scale (so that the results at 2700 MHz aren't skewed), we interpolated the in-between scores. This is a problem with the graphing capability that we have within Excel. Basically, ignore results at 2100, 2300, and 2500 MHz - you could probably get scores within a few percent of what shows up on the graphs, but we didn't actually verify this.
Power and Heat
One area that we overlooked last time was the system power draw as well as the CPU temperature. We spent some additional time measuring these items with the X2. Total power draw was measured at the wall using a Kill-A-Watt device. We used a batch file to run 3DMark03, 3DMark05, PCMark04, and PCMark05 sequentially. The maximum power draw invariably came during 3DMark05, with all three game tests falling very close together. Test 1 (Return to Proxycon) and test 2 (Firefly Forest) typically registered a few Watts higher than test 3 (Canyon Flight ), though this trend may not hold with other system configurations. Also, since we were overclocking, AMD's Cool 'n Quiet feature was disabled - it tends to interfere with overclocking efforts.
In addition to measuring the power draw, we used NVIDIA's nTune System Monitor to record temperatures of the chipset and processor. While we would be hesitant to use the results from nTune across different motherboards due to potential variance, since we are only using one motherboard, the values are measured consistently. The temperatures were measured using the same series of tests, with the 3DMark05 CPU test causing the highest recorded temperatures. (Note that the benchmark results for Futuremark products were collected in a separate run of these tests so that nTune wouldn't impact the results.)
We only recorded temperatures and power draw for one configuration, using the OCZ VX RAM - staring at a Watt meter for 20 minutes per configuration was already bad enough! Informal checks on other configurations showed that the results were consistent - additional RAM in the 2GB configurations drew a bit more power, but CPU and chipset temperatures were within 1 degree Celsius. Also, unlike the remaining benchmarks, we verified the voltage requirements, power draw, and temperatures at every setting in 100 MHz increments.
| Power and Temperatures | |||||
| OCZ Gold VX PC4000 2x512MB | |||||
| CPU Clock | CPU Voltage | CPU Temp | Chipse Voltage | Chipset Temp | System Power Draw |
| 2000 | 1.300 | 34.00 | 1.50 | 38 | 248 |
| 2100 | 1.350 | 36.00 | 1.50 | 38 | 260 |
| 2200 | 1.350 | 36.00 | 1.50 | 38 | 262 |
| 2300 | 1.350 | 39.00 | 1.50 | 38 | 266 |
| 2400 | 1.400 | 44.00 | 1.60 | 39 | 275 |
| 2500 | 1.475 | 47.00 | 1.60 | 39 | 290 |
| 2600 | 1.500 | 48.00 | 1.60 | 41 | 298 |
| 2700 | 1.700 | 72.00 | 1.70 | 47 | 369 |
For those who prefer a graphical representation of the data, here are the charts for the above table.
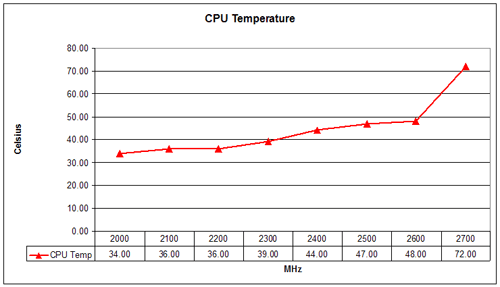
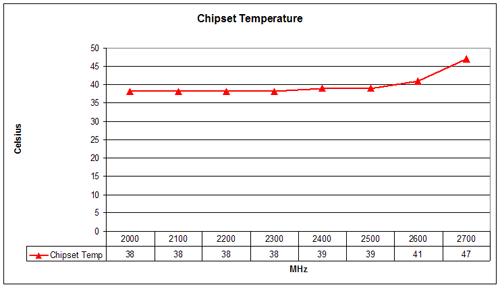
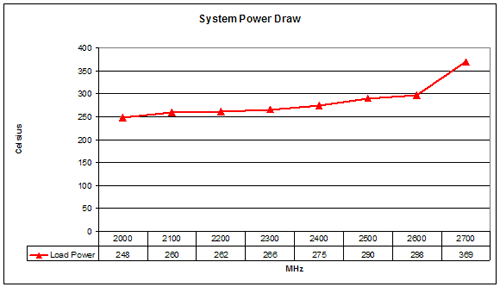
It comes as no surprise that both the power draw and CPU temperatures increase as clock speed and voltage increase. The jump from 2.6 GHz to 2.7 GHz comes with a dramatic change in CPU temperature, and we would definitely advise against running this particular CPU at 2.7 GHz without additional cooling. Voltage and heat are good indicators of the maximum stable speed for a CPU, so if you're trying to find your own CPU's sweet spot, you can do so by increasing speed in 100 MHz increments. Run a few CPU intensive tests at each point to verify that the system is "stable" - Futuremark products are pretty good as an overall system stress test. Lather, rinse, and repeat. Slight increases in CPU voltage (and chipset voltage) will usually be required as the clock speed is raised, but eventually you reach a point where the next 100 MHz bump requires a substantial voltage change and comes with much higher temperatures.
Looking at our chart, you can see that most of the 100 MHz increases required a 0.00 to 0.050 CPU voltage increase. From 2.4 GHz to 2.6 GHz, we had to add 0.10V, but that's still not too bad. The last 100 MHz to reach 2.7 GHz required an additional 0.20V - four times as much per MHz as the previous step! We also tried every voltage from 1.500V to the maximum 1.850V and were unable to get the system fully stable at 2.7 GHz. That's a lot of voltage for a CPU rated at 1.300V, but we gave it a shot anyway. For most people, we'd say 1.500V is the safe limit on air cooling, though some people will feel okay pushing a bit further. We also recommend that you try to keep 90nm AMD chip temperatures under 50 degrees C. As you can see, the 2.7 GHz speed exceeds both of these thresholds, and it doesn't even do so with full stability. 2.6 GHz, on the other hand. falls in line with these limits and ran without any difficulty - at least with our particular setup.
One final note is that the power draw and temperatures can vary a lot with the task. Most games showed similar maximum power draw to 3DMark05 in informal testing, but usually only under high-stress situations. HL2 ranged from about 205W maximum at 800x600 0xAA to 262W maximum at 1600x1200 4xAA (with a CPU clock speed of 2.20 GHz). The average power draw under load was also quite a bit lower than the peak values reported; generally, average power was 15 to 25 Watts lower than the maximum.
By the way, yes, we are aware that measuring power at the outlet is not the same as measuring the output power of the PSU. Power supply inefficiencies come into play, but since we're only using one PSU (and this isn't a power supply test), the numbers are still valid. An inefficient power supply will draw more power from the wall, but the results shown are internally consistent.
RAM Latency
In the Venice article, we talked quite a bit about memory latencies and how they affect performance. Since we're using four different types of RAM this time, we will most likely see more variation in RAM latencies. However, even a relatively large difference of 20% will often have less than a 5% impact on real world application performance. Another item to pay attention to is the difference between higher bandwidth vs. lower latencies that the OCZ VX and EL Platinum represent.
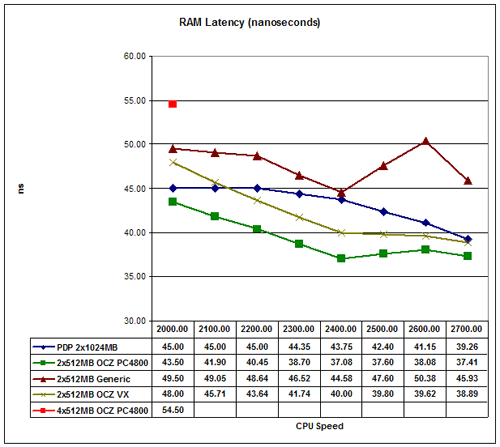
CPU-Z includes a latency.exe program that we used to get these values, and we selected the score in the bottom-right of the table. This position represents a 32MB data set with a 512 KB stride size, and the results are reported in CPU cycles. We have two charts again, the first in CPU cycles and the second in nanoseconds. Since cycle time decreases as clock speed increases, we would pay a bit more attention to the results in nanoseconds. However, the elapsed CPU cycles are also important as they represent wasted CPU time. If cache misses are relatively constant - and they are - then the higher the RAM latency is in CPU cycles, the less efficient the processor becomes. Here are the results.
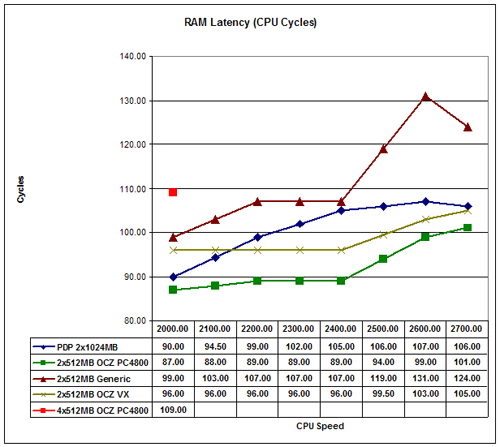
Since all of the various configurations ran successfully with 1T timings, latencies stay relatively close - even the value RAM isn't that far behind the fastest RAM used. We couldn't get results for 4x512MB except at stock clock speeds, but comparing the scores at 10x200 is still possible. You can clearly see how much the 2T command rate impacts performance, which brings up another point: a lot of value RAM is not guaranteed to run at 1T command rates. This same value RAM required 2T command rate with the Venice chip for the 9x300 setting, even though it was still running below its rated DDR400 speed. Your mileage may vary.
Something else that we failed to mention last time was the numerous in-between options for RAM. 2.5-3-3-7/8 RAM can be purchased for around $80, give or take. In the $100 to $130 price range, there are many sets of 2x512MB DIMMs rated for 2-3-3-6-1T or 2-3-2-5-1T timings. The difference between CL2 and CL2.5 isn't huge, but it may warrant spending an extra $20. The true performance/overclocking RAM starts at around $120 (Crucial Ballistix - really an awesome deal if you ask me!) and goes up from there to over $200. That's a dramatic price increase on the high-end for what is likely to be a small performance difference, but there is something to be said for the ease of use that expensive RAM offers. Where we had to do some work finding the optimal performance settings on value RAM at the various overclocked speeds (and we really only scratched the surface), the OCZ EL Platinum could usually be left at a DDR-400 setting in the BIOS with 2.5-3-3-7-1T timings. It wasn't optimal in all cases, but it required very little effort to find a stable overclock.
The OCZ VX is definitely held back by the Infinity motherboard. 3.2V is the minimum required voltage for stable 2-2-2-8-1T timings. We were able to reach as high as DDR-452 speeds while maintaining 2-2-2-8 timings, but DDR-460 required 2-3-2-8-1T and DDR-500 required 2-3-3-8-1T timings. Beyond DDR-500, even raising CL to 2.5 didn't help much. OCZ VX is still very fast RAM, but it really needs the best in terms of motherboards to reach its full potential. In the RAM area, we now have two strikes against our selected motherboard.
RAM Ratios
We mentioned before that additional RAM ratios would be helpful, and higher end motherboards like the DFI LanParty series often provide them. The Infinity board is limited to DDR400, DDR333, DDR300, DDR266, and DDR200 – at least with the current BIOS. In reality, these are not exact speeds but rather the maximum speed at which the RAM will run with the CPU at stock speed. RAM speed on AMD K8 systems is derived from the CPU speed. With our X2 3800+, “DDR400” results in a CPU/10 RAM divider. 2000/10 = 200 MHz. The 10X multiplier actually makes for very nice RAM speeds, as CPU/12 = 166.7 MHz, CPU/15 = 133.3 MHz, and CPU/20 = 100 MHz. The DDR300 setting is the only one that’s off, as 2000/14 = 143 MHz.
With other motherboards, you may get several additional memory ratios, including those above DDR-400. This provides additional options for reaching maximum performance. In the end, the memory ratios come down to one point. All things being equal (i.e. with identical timings), higher bandwidth will be faster. It may not be a lot faster, but it could be a difference of several percent.
Was that a third strike against the Infinity motherboard? Though we would still say it packs a lot into a $90 board, we would recommend that serious enthusiasts spend a bit more money. The LanParty Ultra-D from DFI is only $20 more, and it has quite a few advantages over the Infinity that will be appreciated by more ambitious overclockers. The Ultra-D is basically the same as the SLI-D, only without official SLI support. Motherboards based on ATI's latest chipset also show promise – check out our motherboard reviews for more details on specific motherboards.
We could have tried several different motherboards to see if we could achieve better results, but this isn’t a motherboard or RAM article, even though it has aspects of both types of reviews. This is merely intended as an aid in showing people what can be achieved using the options available with various RAM types on one motherboard with one CPU. In other words, don’t read too much into the memory results. Use them as a guideline for optimizing your own system performance.
Application Performance
Moving on to more real-world applications, we'll start with Winstones 2004. Winstones run a bunch of scripts in a variety of applications. The problem is that many of the scripts simulate user input and operate at speeds no human can approach. Rendering an image, encoding audio or video, etc. can take time. Word, Excel, and Outlook, on the other hand, are almost entirely user-limited. While the fastest systems do perform higher, in every day use, the typical office applications are going to run so fast that differentiating between the various overclocked settings is difficult, if not impossible.
Normally (i.e. using the default settings), Winstones will defrag the hard drive, run through the script, reboot the system, and then start over. It does this five times, and the highest score is shown. Depending on your personal view, however, the reboot isn't really necessary. In fact, eliminating the reboot will generally result in higher scores on subsequent runs - a difference of as much as 15%. The Venice overclocking article allowed reboots to occur, but this time, I took that step out. The result is slightly higher scores compared to the Venice article, helped in part by the dual cores, but also by the removal of the reboots. The individual articles present comparable results, but you shouldn't directly compare the results. Honestly, Winstones isn't a terribly important measurement of performance anyway, but some people still worry about application performance.
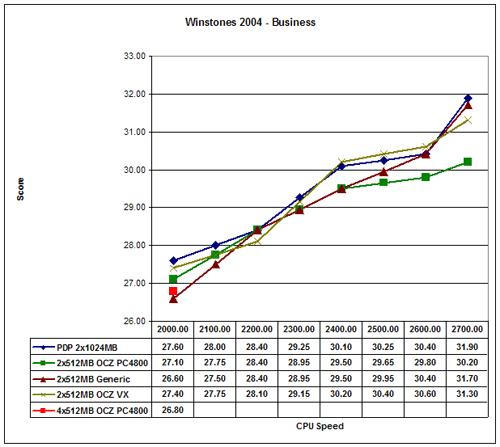
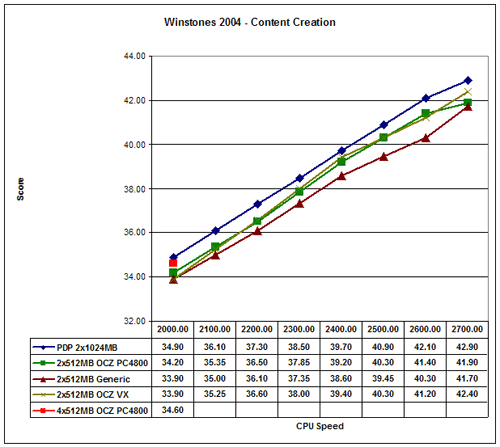
We get a decent performance increase from overclocking, but nowhere near the theoretical maximum. If you look at single-core vs. dual core performance, it's also obvious that Winstones doesn't benefit much from the addition of a second core. That's understandable, as the tests are not done in a multitasking fashion, but newer multimedia applications should show more of a performance difference. Going from 2.0 GHz to 2.7 GHz represents a 35% CPU performance increase. In the Business Winstones test, we see a range from 26.6 to 31.9, a 20% increase. The Content Creation test gives a slightly larger increase, ranging from 33.9 to 42.9 - 27% more performance. Basically, what we're seeing is that Winstones really isn't completely CPU limited.
The different memory types also have very little impact on performance. Overall, the fastest RAM configuration ended up being the 2 GB set up, but only by a small percent - well within the margin of error for Winstones. The value memory is the slowest performer, which it should be given the lower price, but the difference isn't nearly as large as some people would expect. If you're going for a relatively expensive dual core processor, the results here aren't very conclusive. Still, if you need multitasking performance, more memory is a reasonable accessory.
Similar in some ways to Winstones performance, PCMark attempts to gauge system performance. The results are a little more theoretical, but the simulated applications are, in many instances, more recent and will benefit more from dual cores. PCMark also includes some 2D and 3D graphics tests, which make the GPU somewhat important to the overall score. If you compare results to those of the Venice article, you'll need to take the 7800GTX impact into consideration.
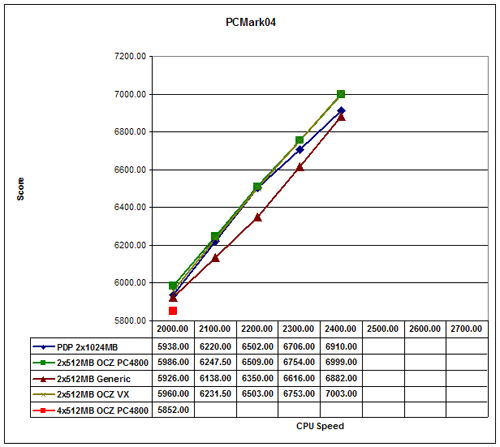
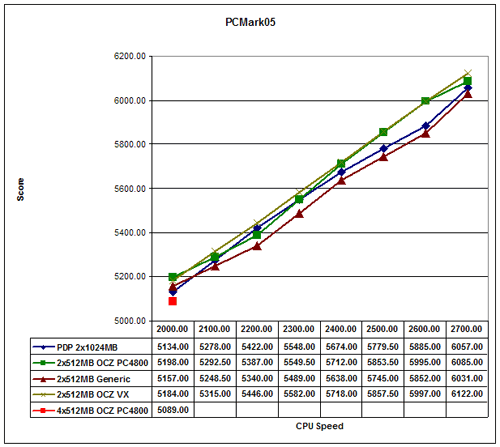
The difference between the slowest and fastest scores for our configuration is about the same as Winstones. PCMark04 goes from 5852 to 6999, a 20% increase. Unfortunately, PCMark04 was one application that consistently crashed at 2.4 GHz and above. Actually, crashed isn't the correct term; the grammar portion of the third multitasking test repeatedly failed. However, this is the only test that failed consistently above 2.4 GHz, so it's something of an anomaly. Everything appeared to run without issue, and we could get results for test 3 on its own, but we couldn't get the entire suite to complete. PCMark05 shows less of a difference, ranging from 5089 to 6101 (20%). PCMark05 also required the installation of the AMD CPU driver in order to produce acceptable scores. Without the driver installed, all HDD tests scored close to 0, severely impacting the results.
Both of the PCMark tests serve as great stress-tests of CPU overclocks, which is one of the reasons why we include the results. The issues with PCMark04 are difficult to explain, since in other testing, we have felt that PCMark05 was more strenuous. We did run all of the other tests in both PCMark products (scores not shown), and all of them passed. If we had encountered additional errors in either one, we would be more hesitant to call the 04 results into question, but for now, we're relatively confident that the 2.6 GHz overclock is stable.
In case the graphs don't convey this fact well enough, our standard application scores benefited very little from the use of higher quality RAM. The addition of a second core also didn't help a whole lot in many instances, which is generally true of real world application performance. Other tasks will definitely benefit, and the overall user experience feels smoother and faster with a dual core chip, but if you mostly just surf the web, you'll be wasting money on such a fast system.
Encoding Performance
For our encoding performance tests, we use AutoGK 1.96 with both the DivX and Xvid codecs. (A newer version of AutoGK is now available, but performance and scores didn't change noticeably, and so, we will continue using the older version.) We encode chapter 9 from The Sum of All Fears without audio to 75% quality. This results in a file size about 1/3 as large as the original (not counting the audio size). As a more common encoding task, we also encode a TV commercial from 30 MB down to 5 MB, including audio encoding. This results in three encoding passes: the compression test, a first pass, and the final pass. We take the total number of frames in the video (900) and divide it by the time taken, reporting the resulting frames per second. In all AutoGK benchmarks, higher scores will be better.

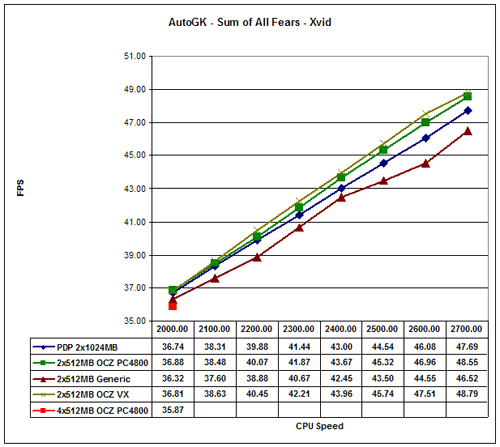

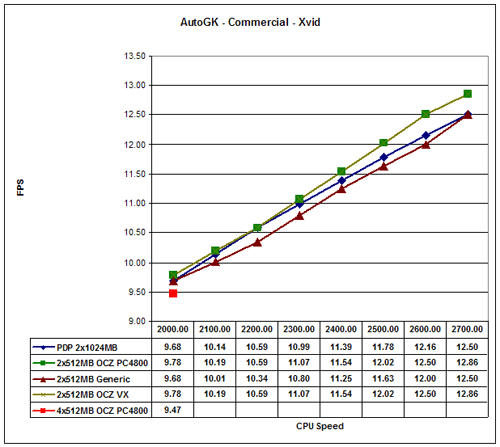
The performance difference between the slowest and fastest setup is around 35% for every encoding task, scaling linearly with processor speed. AutoGK runs a lot more of the computations within the CPU and doesn't depend much on user input, and it also benefits from multiple processor cores. Compared to the Venice chip, the second core increases DivX performance by about 50% and Xvid performance by about 30%. Comparing the different RAM types, the largest gap is about 4%; so while there is a difference, it's not huge. As we said, clock speed is king for encoding.
Synthetic Gaming Performance
Futuremark's 3DMark applications need little introduction. They may or may not reflect actual game performance - depending on which game you're talking about - yet, since enough people use them, then they are worth looking at.
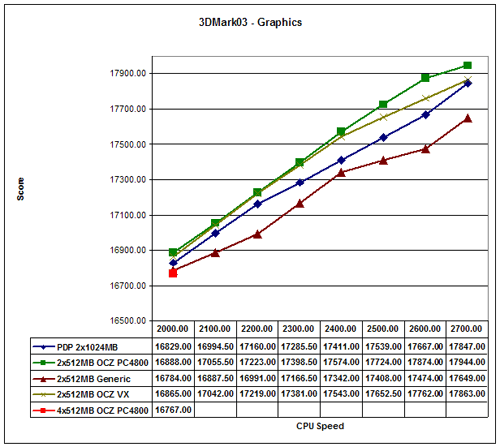
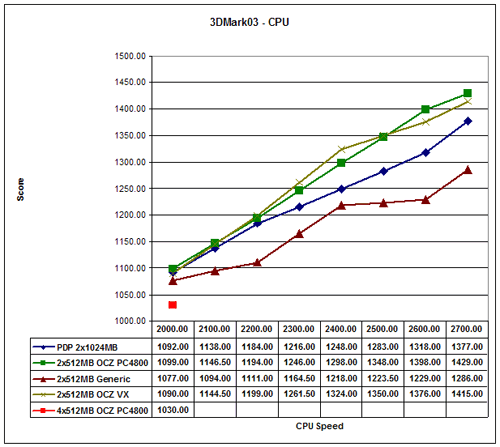
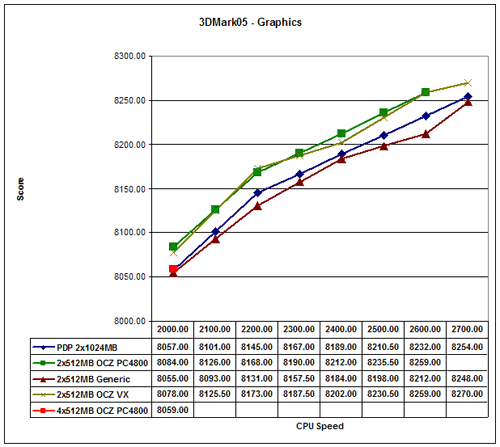
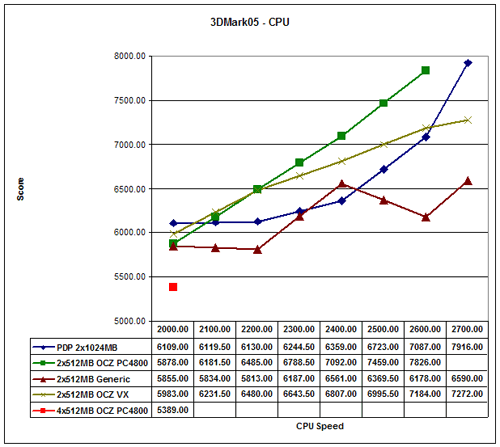
Even with a high-end graphics card like the 7800 GTX 256MB, 3DMark03/05 are largely GPU limited. The earlier version shows a 10% gap between the slowest and fastest configuration, while the 2005 version only shows a 5% difference. On the other hand, the CPU tests scale very well with processor speed and overclocking. There's also a pretty sizable difference between the slowest and fastest memory types - over 10% - and notice that the value RAM actually dropped in performance at the highest overclocks, indicating that memory bandwidth plays a role.
Battlefield 2 Performance
Every game was benchmarked at resolutions ranging from 800x600 to 1600x1200, and several of the titles were also benchmarked at 2048x1536. However, due to the number of test configurations, I am not going to include a chart of every resolution. 800x600 is an unrealistic setting for a high-end system, and likewise, 2048x1536 is not a setting most people use. If you would like to see all of the remaining results, they can be found in this Excel spreadsheet. I may mention some of the other scores, but I'm trying to avoid cluttering up the article with graphs.
Battlefield 2 is a very popular game right now, and the graphics are also very nice. Dropping to lower detail levels can really crank up the frame rates, but if you have a high-end graphics card that won't be necessary. As mentioned before, you can get our Battlefield 2 benchmark utility for version 1.03, or the new release for version 1.12 - note that the results are not directly comparable.
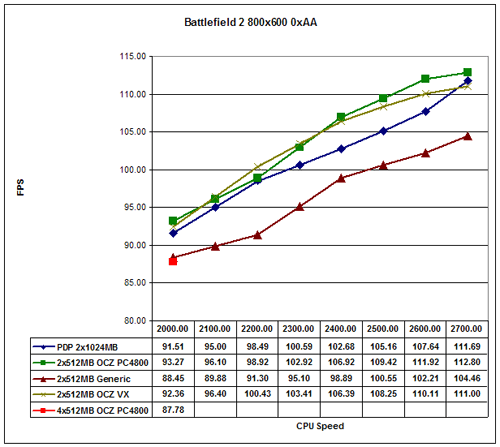
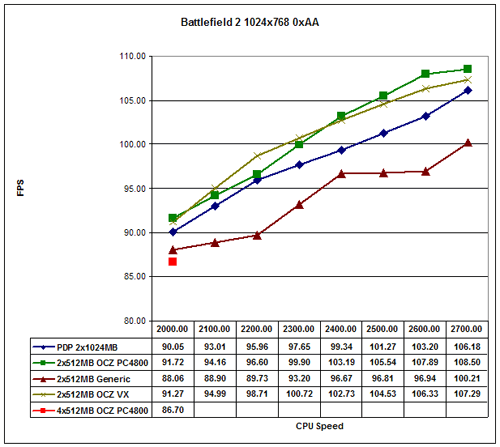

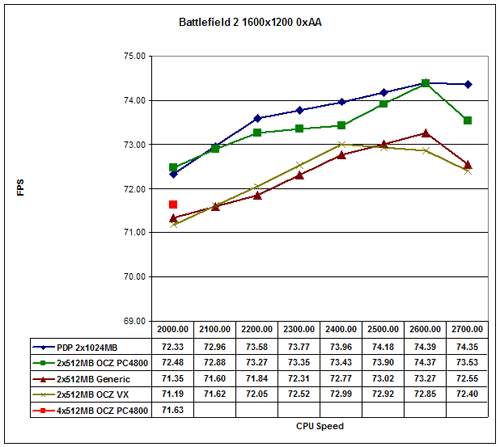
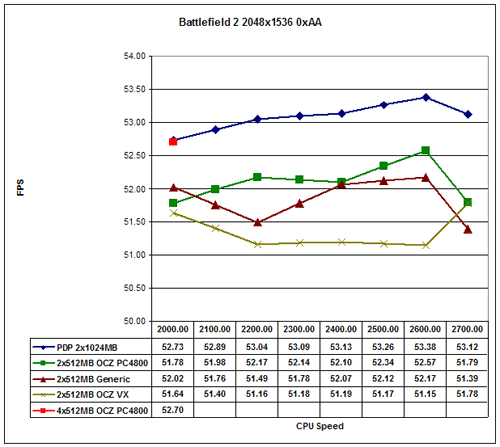
At lower resolutions, performance scales nearly linearly with processor speed. However, at more common resolutions for high-end computers, the graphics card quickly becomes a limiting factor. At 800x600, there's a 38% spread. That drops to 31% at 1024x768, 18% at 1280x1024, and 10% or less at the highest resolutions. This is without antialiasing enabled, and high resolutions with 4xAA are almost completely GPU limited.
The choice of RAM has a pretty large impact when we are CPU limited, but as resolution scales, it becomes less important. One thing that you can't see very well from the graphs is the impact that 2 GB of RAM has on hard drive access. At the higher resolutions, the increased memory size comes out on top, and it also provides more consistent frame rates. There is little to no hard drive access when you have 2 GB of RAM and are playing Battlefield 2. Level load times are also about 50% faster with 2 GB of RAM, and BF2 also exits quickly if you have more RAM.
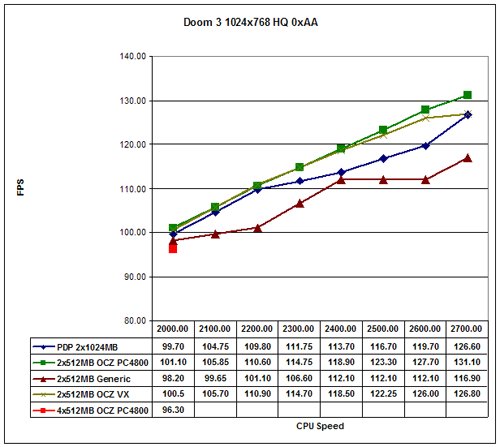
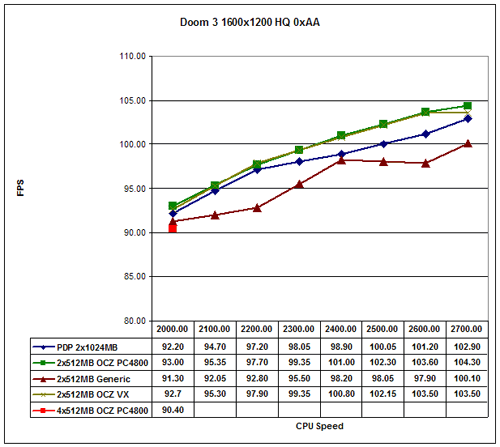
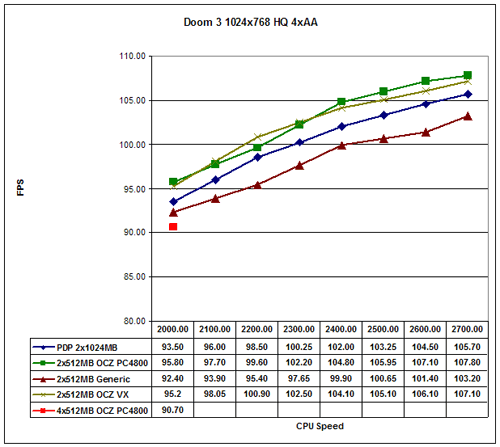
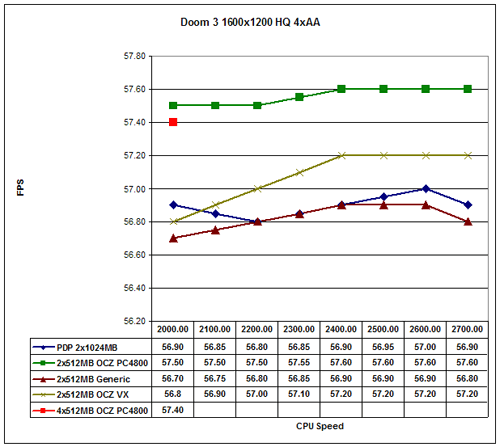
Doom 3 and Quake 4 Performance
We ran tests with both Doom 3 as well as Quake 4, and while the numbers aren't identical, the trends are similar. Quake 4 disables some of the graphical effects during the time demo, so I know that in real gameplay with audio enabled, your frame rates will be significantly lower than what we're showing here.
Doom 3:
Quake 4:
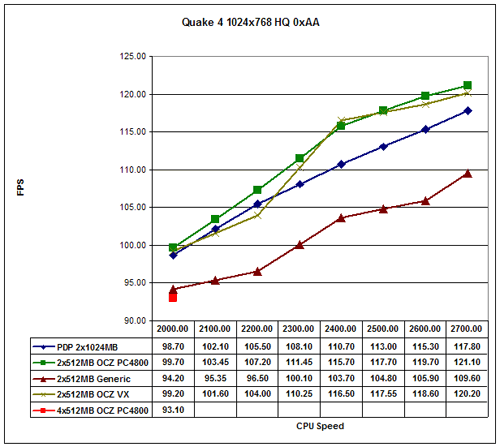
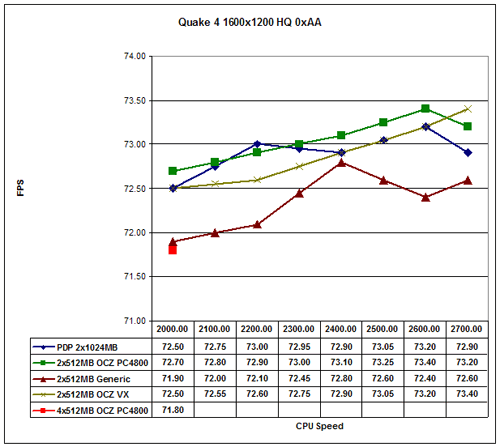
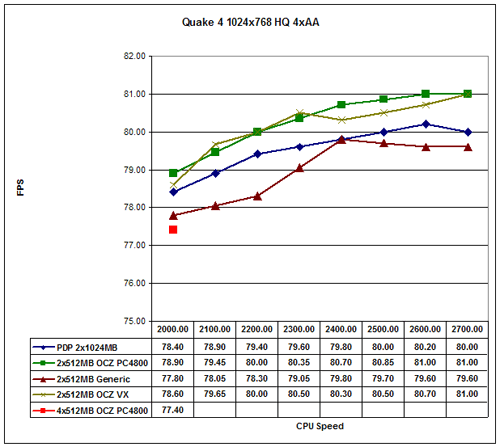
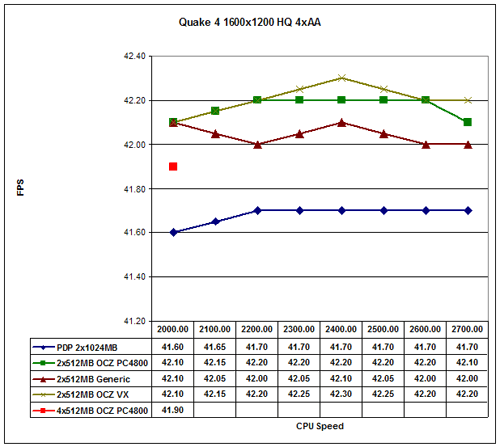
At low resolutions, performance once again scales linearly with processor speed. We still see large gaps across the board... until we enable 4xAA. At 1280x1024 and 1600x1200, antialiasing reduces the performance gap to less than 10%. Unless you're running SLI with high-end graphics cards, you won't need the world's fastest processor to get the most out of Doom 3 and Quake 4.
Far Cry Performance
Yes, our benchmarks are decidedly FPS-centric. Unfortunately, first-person shooters are the one of the only genres that pays significant attention to benchmarking tools. It's also worth noting that many other genres do not require as high end of hardware. If you can run all of the latest first-person shooters at high frame rates, you should be fine when running strategy games and the like. Flight simulations might do better with a faster CPU, though.


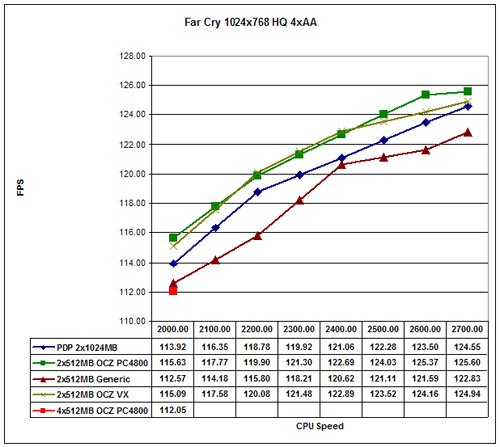
We experienced consistent crashes during Far Cry testing; however, it's not what you might expect. Our XFX 7800 GTX comes factory overclocked, and unfortunately the overclocking isn't entirely stable. The Regulator level consistently crashed at high resolutions, with and without antialiasing - though 4xAA crashes were far more frequent. Reducing the clock speeds to stock 7800 GTX values got rid of the crashes, but we didn't want to have to rerun all of the other benchmarks. We should note that the Regulator level was the only instance where we experienced crashes related to the GPU, but the net result is that the Far Cry numbers at 1280x1024 and higher resolutions aren't entirely reliable. Since we couldn't get results at 1600x1200 4xAA with most of the configurations, we chose to not show the results for that setting.
Needless to say, if you have a factory overclocked card that consistently crashes in certain games, you might want to try underclocking it. Yes, it should work at the advertised speeds, but you can at least reliably determine whether or not the factory OC is the cause of your problems .
Besides the problems with stability, Far Cry continues the trends we've seen so far. At lower resolutions, there's a pretty significant difference between the fastest and slowest RAM/processor configurations. The value memory can be as much as 10% slower, but as we run into the limits of the graphics card, everything evens out. If you have to choose between is significantly faster processor and is significantly faster graphics card, for gaming the latter should always take priority.
FEAR Performance
FEAR is one of the more recent games to come on the market, and it is capable of bringing even high-end systems to their knees. It's a good game, and it's one of the better looking shooters, but you will most likely need to turn down detail levels to get acceptable frame rates on most PCs. We used the built-in benchmark utility, running version 1.01 of the game. A newer version is available, though I don't think performance changes all that much.
Incidentally, I failed to collect results for the OCZ VX RAM from FEAR, but given how close everything is, you're not missing out on much. (A few quick tests showed that the VX RAM was about identical to the Platinum... and the value and the PDP RAM as well.)
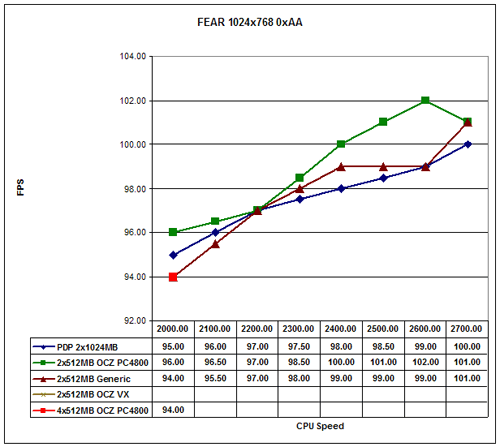
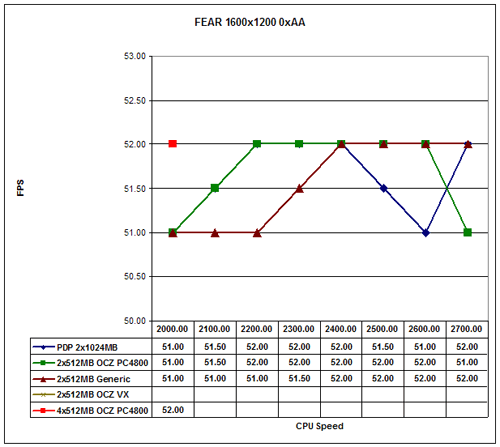
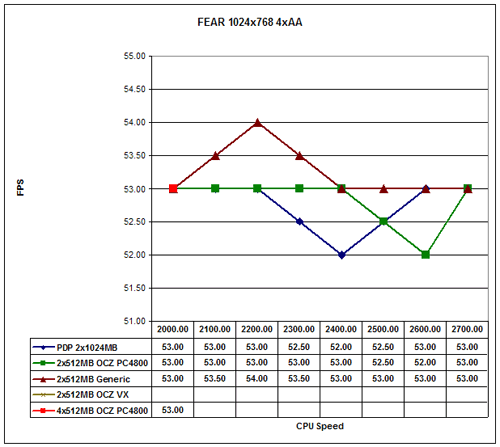
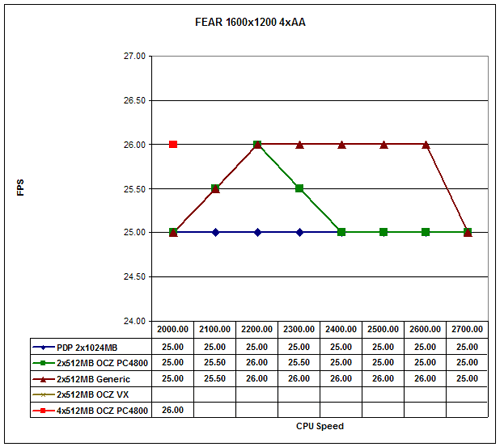
At the lowest two resolutions without antialiasing, overclocking can increase performance by 10-15%. Once you reach higher resolutions, though, the game is almost completely GPU limited. A 4% difference at 1024x768 and 1600x1200 with 4xAA is negligible and within the margin of error for the benchmark. (Results are only giving in whole numbers, causing the jagged appearance of our charts at the high detail settings.) 1600x1200 without AA is playable, as is 1024x768 with 4xAA. We would take the higher resolution over AA, though.
Half-Life 2 Performance
Our last game is Half-Life 2. The Source engine will be used in a variety of upcoming games - most of them first-person shooters, of course - so it remains an important benchmark. High dynamic range lighting effects may reduce the overall performance, but I'm not convinced that HDR is the panacea that developers are pushing. That's a topic for another day, however.
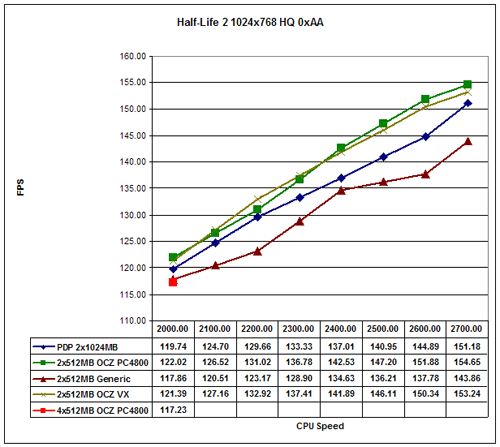
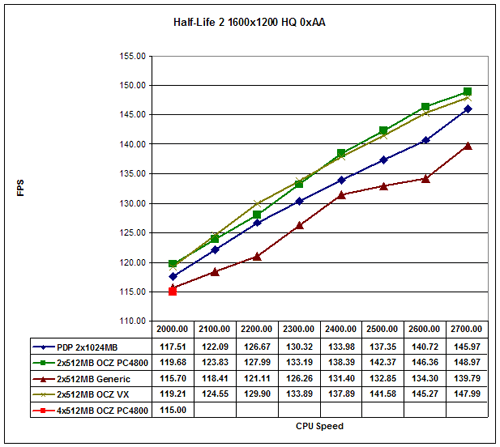
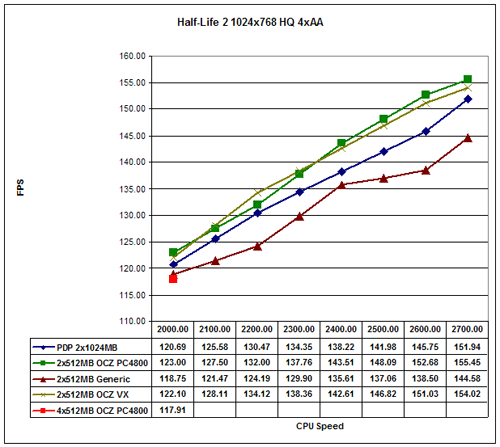
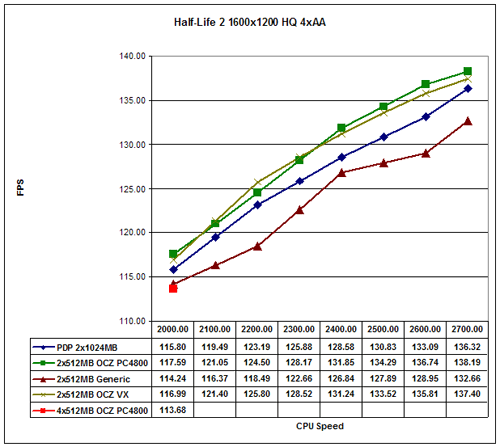
Half-Life 2 is one of the few titles that remains largely processor limited. Performance scaling is about 35% for all of the resolutions tested, with the exception of 1600x1200 and above - particularly with anti-aliasing enabled. At most resolutions, value RAM with overclocking can be about 6% slower, worst-case. Note that if you're not overclocking, value RAM is only a couple of percent slower.
Closing Thoughts
I'm certain that there are going to be plenty of you who've read this and think, "yeah - so what?" As I said at the outset, this article isn't targeting the hard-core enthusiast or overclocker. Everyone needs to learn how to overclock somewhere (at least if they're interested in that sort of thing), and if nothing else, this should give you an idea of what results to expect, as well as some reasonable starting settings. Again, your results may vary.
Looking at the different RAM options, it's difficult to make a good case for spending tons of money on memory. Yes, it can improve performance by 10% or more in some cases, but in many instances, you will be bottlenecked by some other component in the system. There is one other point to mention on the memory: overclocking with four 512MB DIMMs was almost a complete failure on the setup that we used. Other motherboards, or perhaps a BIOS update for this motherboard, might improve the results, but for now we would recommend caution with such attempts. If you want to run 2GB of RAM, two 1GB DIMMs would be a much better choice. Having that much memory certainly isn't required, but then again, neither is a dual core processor. Personally, I'm done purchasing 512MB DIMMs for myself.
Something many AMD users are concerned with right now is the pending switch to socket M2 and DDR2 memory. From my perspective, it's really not a big deal. Everything that we've heard indicates that the switch will be little more than a change in the memory controller in order to support the new RAM type. If we could compare a 2.4 GHz Athlon X2 with the future DDR2 equivalent right now, I would wager heavily that the difference will be less than 10%. Buying an X2 3800+ right now and overclocking it to 2.6 GHz will, in all likelihood, match the best official dual core processor that AMD will release during the next nine months. (You might also try to get one of the dual core Opteron chips, with which many people are overclocking to 2.8 GHz and beyond.)
I'm not yet done overclocking this Manchester chip, as I want to take a closer look at how the heatsink used affects overclocking performance. What can you reasonably expect from the stock HSF, what can you get with performance air cooling, and how much better is water cooling? I'm already working on gathering results covering these questions. If you have any specific requests or suggestions before then, let me know.


