Original Link: https://www.anandtech.com/show/2298
Western Digital SE16 750GB: "Quiet" a Performer
by Dave Robinet on August 9, 2007 2:00 AM EST- Posted in
- Storage
The Hard Drive Wars
Western Digital owns the second largest portion of the hard drive market, trailing only Seagate in terms of total number of drives shipped. The company accounts for roughly 21.5% of global hard drive sales, which puts it a long way from either taking the lead from Seagate (34.6%) or losing its seat to third-place Hitachi, which is at 17.2%. These numbers have remained fairly consistent for the past year, and hide what has become a fiercely competitive fight for the most lucrative portions of the market.
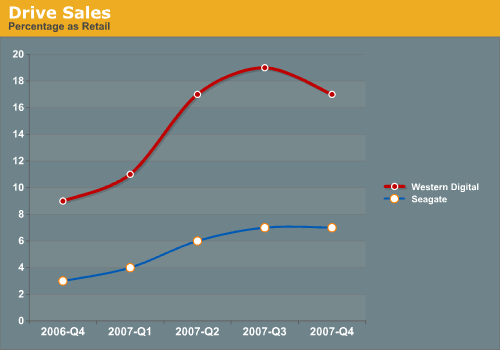
Sales to OEM customers (that is to say, companies which buy large quantities of drives in bulk to put into computers or other devices) tend to be substantially less profitable than packaging drives in attractive boxes and selling them individually to consumers. OEM customers have entire departments devoted to squeezing pennies from manufacturers when negotiating these large buys, whereas a typical end-user has very limited influence over the price they pay for their drives. As the chart shows, both Western Digital and Seagate have dramatically reduced their percentage of sales to the OEM category, and are putting significant effort into expanding their retail presence in the market.
While retail consumers are largely unable to negotiate prices, they are generally more selective than OEMs in terms of the features they want from their drives. This has led to manufacturers focusing on improving the drives they market to end-users, and the resulting benefits in terms of capacity, performance, and feature sets have been obvious.
Western Digital's SE16 Line
Officially designated as being intended for high-performance desktop applications, the SE16 takes WD's mainstream SE line one step further by increasing the drive's cache to 16MB (vs. 8MB in the SE line), and adding WD proprietary technologies like SecurePark and Preemptive Wear Leveling (PWL). The resulting specifications allow for a 20% faster transfer rate (buffer to disk) than similar drives found on Western Digital's SE line, as well as a notable reduction in power consumption. These factors, combined with Western Digital's decision to extend the warranty of all Caviar-class drives purchased after August 1, 2007 to 3 years, gives Western Digital a powerful combination in their continued push for more retail market share.
Drive Specifications
| Hard Drive Specifications | |||
| Western Digital Caviar SE16 WD7500AAKS |
Hitachi Deskstar 7K1000 HDS721075KLA330 |
Seagate Barracuda 7200.10 ST3750640AS-RK |
|
| Stated Capacity | 750GB | 750GB | 750GB |
| Interface | SATA 3Gb/s | SATA 3Gb/s | SATA 3Gb/s |
| Rotational Speed | 7,200 RPM | 7,200 RPM | 7,200 RPM |
| Cache Size | 16 MB | 16 MB | 16 MB |
| Average Latency | 4.2 ms (nominal) | 4.17 ms (nominal) | 4.16 ms (nominal) |
| Read Seek Time | 8.9 ms | 8.5 ms | 8.5 ms |
| Number of Heads | 8 | 8 | 8 |
| Number of Platters | 4 | 4 | 4 |
| Power Draw Idle / Load | 8.6W / 10.7W | 8.1W / 12.8W | 8.6W / 12.6W |
| Command Queuing | Native Command Queuing | Native Command Queuing | Native Command Queuing |
| Warranty | 3 Year - Retail or OEM | 3 Year - Retail or OEM | 5 Year - Retail or OEM |
The 750AAKS has technical specifications similar to its competition from Seagate and Hitachi. Seagate continues to offer the most attractive warranty, though the power consumption at load of the Western Digital is by far the lowest among its peers. Other specifications (seek time, latency, etc.) are all close enough as to be virtually indistinguishable among the drives.
The current street price for the Western Digital 750AAKS is around $190, while the Hitachi drive comes in at about $235 and the Seagate 7200.10 750GB at $199.
Feature Set
The 7500AAKS drive is equipped with all of the standard features found in the SE16 line, but has had two additional features added which are not present on the smaller capacity drives: Perpendicular Magnetic Recording (PMR), and StableTrac. PMR, which we've described in previous articles, is a means of achieving a higher data storage density (without changing the disk media). This is different than the more traditional method of longitudinal magnetic recording, which has nearly reached its limit in terms of data density. StableTrac, which is a proprietary technology by Western Digital, essentially means that the motor shaft is secured at both ends to reduce the effects (and generation) of vibration in the system.
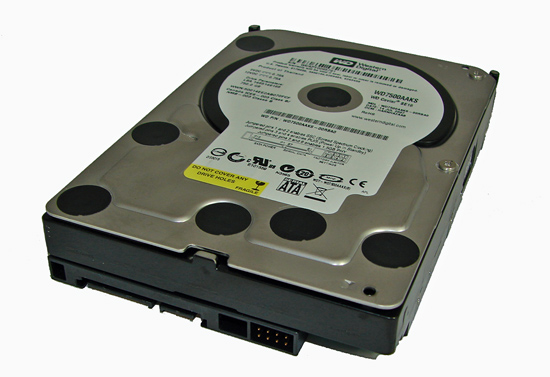
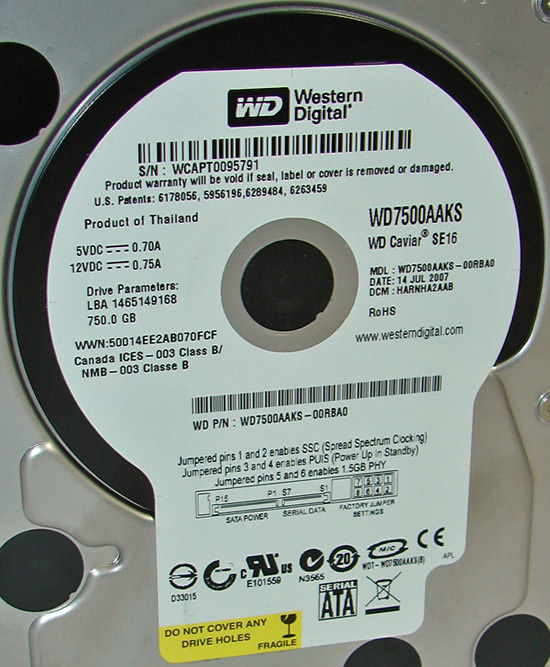
The 7500AAKS is a 3.5" form factor drive, with the standard white Western Digital sticker outlining the basic specifications (capacity, drive parameters, etc).
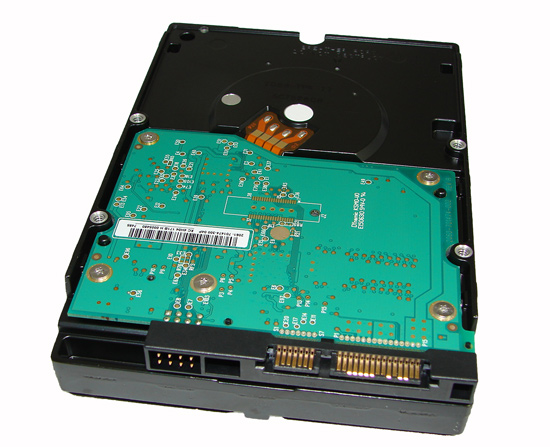
Western Digital has followed the lead of other manufacturers in removing the 4 pin MOLEX connector on this drive which was used in older ATX power supplies. The SATA power port is therefore the only available power option.
Hardware Setup
| Standard Test Bed Playback of iPEAK Trace Files and Test Application Results |
|
| Processor | Intel QX6700 - 2.66GHz Quad Core |
| Motherboard | DFI Infinity 965-S |
| RAM | 2 x 1GB OCZ Reaper PC2-9200 Settings - DDR2-800, 3-4-3-9 |
| OS Hard Drive | 1 x Western Digital WD1500 Raptor - 150GB |
| System Platform Drivers | Intel 8.1.1.1010 Intel Matrix RAID 6.2.1.1002 |
| Video Card | 1 x MSI 8800GTX |
| Video Drivers | NVIDIA Forceware 158.19 |
| Optical Drive | Plextor PX-760A, Plextor PX-B900A |
| Cooling | Tuniq 120 |
| Power Supply | Corsair HX620W |
| Case | Cooler Master CM Stacker 830 |
| Operating System | Windows XP Professional SP2 |
We are utilizing an Intel QX6700 quad core CPU to ensure we are not CPU limited in our testing. A 2GB memory configuration is standard in our XP test bed as most enthusiasts are currently purchasing this amount of RAM. Our choice of high-range OCZ Flex XLC PC2-9200 memory offers a very wide range of memory settings with timings of 3-4-3-9 used for our benchmark results. The Corsair HX620W power supply is utilized to ensure our power supply is seen and basically not heard during testing.
Our test bed now includes a water-cooled MSI 8800 GTX video card to make sure our game tests are not completely GPU bound and to reduce noise/heat levels. Our video tests are run at 1280x1024 and High Quality settings for storage reviews. All of our tests are run in an enclosed case with a dual optical/hard drive setup to reflect a moderately loaded system platform. Windows XP SP2 is fully updated and we load a clean drive image for each system to keep driver conflicts to a minimum.
The drive is formatted before each test run and five tests are completed on each drive in order to produce consistent benchmark results. The two high and low scores are removed with the remaining score representing our reported result. We utilize the Intel ICH8R SATA ports along with the latest Intel Matrix Storage driver to guarantee consistency in our playback results when utilizing NCQ, TCQ, or RAID settings. The Windows XP swap file is set to a static 2048MB and we clean the prefetch folder after each benchmark.
Software Test Suite
With the variety of disk drive benchmarks available, we needed a means of comparing the true performance of the hard drives in real world applications. While we will continue to utilize HD Tach, HD Tune, and PCMark05 for comparative benchmarks our logical choice for application benchmarking is the Intel iPEAK Storage Performance Toolkit version 3. The iPEAK tests can be designed to measure "pure" hard disk performance, and in this case we keep the host adapter consistent while varying the hard drive models.
We utilize the iPEAK WinTrace32 program to record precise I/O operations when running real world benchmarks. We then utilize the iPEAK AnalyzeTrace program to review the disk trace file for integrity and ensure our trace files have properly captured the activities we require. Intel's RankDisk utility is used to play back the workload of all I/O operations that took place during the recording.
RankDisk generates results in a mean service time in milliseconds format; in other words, it gives the average time that each drive took to fulfill each I/O operation. In order to make the data more understandable, we report the scores as an average number of I/O operations per second so that higher scores translate into better performance in all of our iPEAK results. While these measurements will provide a score representing "pure" hard drive performance, the actual impact on real world applications can and will be different due to system factors.
Our iPEAK tests represent a fairly extensive cross-section of applications and usage patterns for both the general and enthusiast user. We will tailor these benchmarks with an eye towards the drive's intended usage and feature set when compared to similar drives. Hopefully our comments in the results sections will offer proper guidance for making a purchasing decision in these situations. Our iPEAK Test Suite consists of the following benchmarks.
VeriTest Business Winstone 2004 - trace file of the entire test suite that includes applications such as Microsoft Office XP, WinZip 8.1, and Norton Antivirus 2003.
VeriTest Multimedia Content Creation 2004 - trace file of the entire test suite that includes applications such as Adobe Photoshop 7.01, Macromedia Director MX 9.0, Microsoft Windows Media Encoder 9.0, Newtek Lightwave 3D 7.5b, and others.
AVG Antivirus 7.5 - trace file of a complete antivirus scan on our test bed hard drive.
Microsoft Disk Defragmenter - trace file of the complete defragmentation process after the operating system and all applications were installed on our test bed hard drive.
WinRAR 3.70 - trace file of creating a single compressed folder consisting of 444 files in 10 different folders totaling 602MB.
AnyDVD 6.1 - trace file of the time it takes to "rip" the Office Space DVD. We first copy the entire DVD over to our source drives, defragment the drive, and then measure the time it takes for AnyDVD to "rip" the contents to our test drive. While this is not ideal, it does remove the optical drive as a potential bottleneck during the extraction process and allows us to track the write performance of the drive.
Nero Recode 2 - trace file of the time it takes to shrink the entire Office Space DVD that was extracted in the AnyDVD process into a single 4.5GB DVD image.
Game Installation - individual trace files of the time it takes to install Sims 2 and Battlefield 2. We copy each DVD to our secondary test drives, defragment the drive, and then install each game to our source drive.
Game Play - individual trace files that capture the startup and about 15 minutes of game play in each game. The Sims 2 trace file consists of the time it takes to select a pre-configured character, setup a university, downtown, business from each expansion pack (pre-loaded), and then visit each section before returning home. Our final trace file utilizes Battlefield 2 and we play the Daqing Oilfield map in both single and multiplayer mode.
HD Tune / HD Tach
 |
| Click to enlarge |
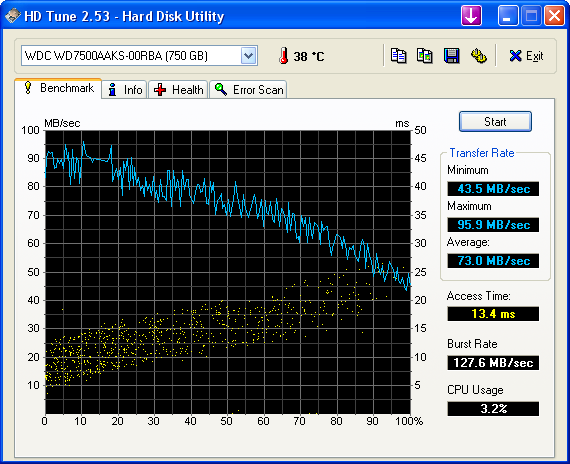
In HD Tune 2.53, the Western Digital drive turns in an average sustained transfer rate of 73.0MB/s, which measures up very well against its peers. In our labs, this has been the fastest result we've recorded to date - very encouraging indeed! The 13.2ms access time reported by HD Tune is merely adequate, landing squarely within the ranks of its peers.
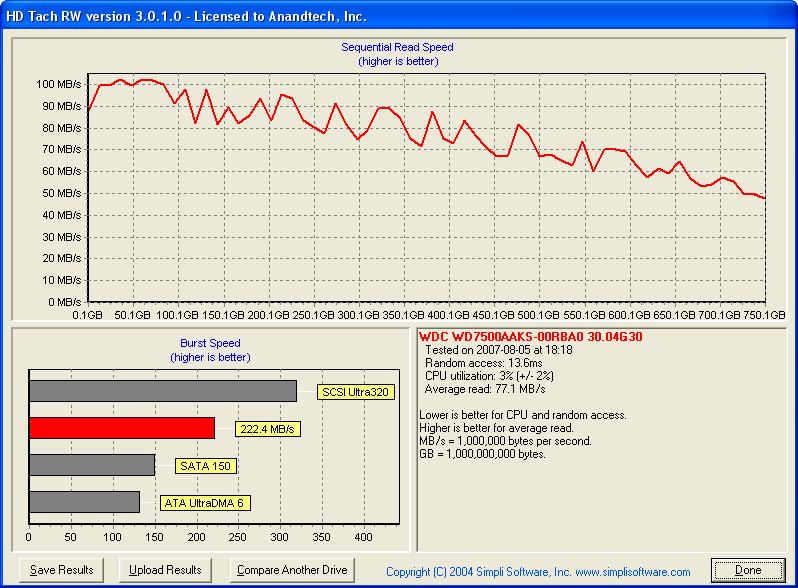
HD Tach clocks the sequential read speed of the 7500AAKS at an average rate of 77.1MB/s, a score again puts the WD7500AAKS above its peers. The Seagate 7200.10 750GB drive, for example, scores 66.9MB/s. The WD7500AAKS even beats the 150GB Western Digital Raptor in this test by nearly 2MB/second, which is no mean feat.
However, it is important to note that access times, average read rates, and burst rate measurements are basically synthetic measurements, and while important these are not "true" application measurements. There is a great deal of potential bottlenecks elsewhere in the system that can and will affect the true performance of a drive. Although these "benchmarks" are a good indicator of a drive's performance, it is the total make-up of components in the PC that will determine the drive's actual performance.
Acoustics
Our acoustic test utilizes our standard test bed components but we implement Intel's power saving technology and turn off the case fans to eliminate as much case noise as possible during testing. Our Corsair power supply is nearly silent in these tests and our MSI 8800GTX video card is water cooled by an external pump/radiator unit to provide a further decrease in our case's ambient noise levels. Our drives are attached to the drive cage with rubber bushings to assist in isolating the noise of the drive and avoid the resulting harmonic changes due to the case design.
Our acoustic tests are designed to measure the decibel levels while the system is at idle and also under load while running the General Hard Disk Drive Usage benchmark within PCMark 2005. We found through trial and error that this particular benchmark produces controlled readings across a wide range of applications within the benchmark. This particular benchmark utilizes 60% reads and 40% writes within the trace playback file.
The measurements are taken at a distance of 5mm from the rear and front of the drive being tested in order to minimize surrounding environmental noise. We have noticed that unless we run a completely silent system in a quiet room that measurements taken from 1m are generally not meaningful because they are lost in the surrounding ambient noise. There are exceptions - like the Raptor series of drives - but overall most modern desktop drives are quieter now than the other components in the system.
The reported measurements are based on an A-weighted decibel score that measures frequencies similar to the way the human ear responds to sound. We take a total of three measurements for each test. We then subtract the high and low scores and arrive at our findings by reporting the remaining score. Our base dB(A) level in the room at time of testing was 25 dB(A).
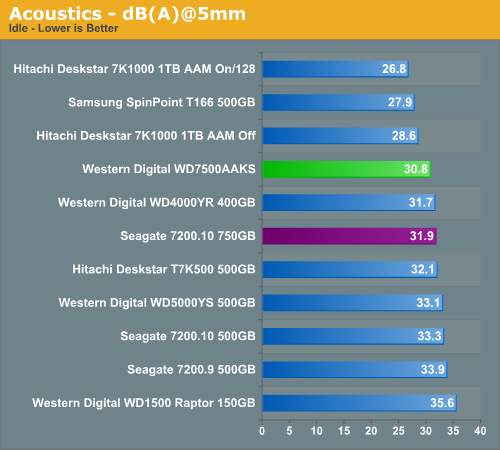
Western Digital's claim of a quiet drive is indeed backed up by our acoustic measurements, though it cannot claim to be the quietest. Its idle noise measurement of just over 30dB(A) makes it a few decibels louder than both the Hitachi 7K1000 and the Samsung T166 drives which we've recently tested in the AnandTech labs. The score does represent nearly a 3 decibel reduction from any Western Digital drive we've previously tested, however, and easily bests the Seagate 750GB 7200.10.
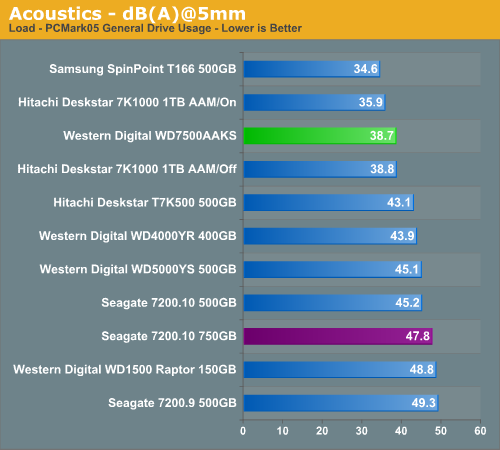
The drive's activity measurements of 38.7dB(A) show the same pattern. The drive is still roughly 4 decibels louder than the whisper-quiet SpinPoint T166, but shows up substantially better than most other desktop drives in this class. The noise emitted by the drive during periods of activity can best be described as a low "thumping" or "pulsing" noise that was not obtrusive but noticeable at times.
Thermals
Our thermal tests utilize sensor readings via the S.M.A.R.T. (Self-Monitoring, Analysis and Reporting Technology) capability of the drives and are reported by utilizing the Active SMART 2.42 utility. We also utilize thermal sensors and infrared measurement devices to verify our results. We test our drives in an enclosed case environment without the fans operational to simulate temperatures that could conceivably be reached in a near silent SFF or HTPC case design. We typically find the reported numbers drop anywhere from 18% to 25% with the case fans operational. Our base temperature level in the room at the time of testing was 25C.
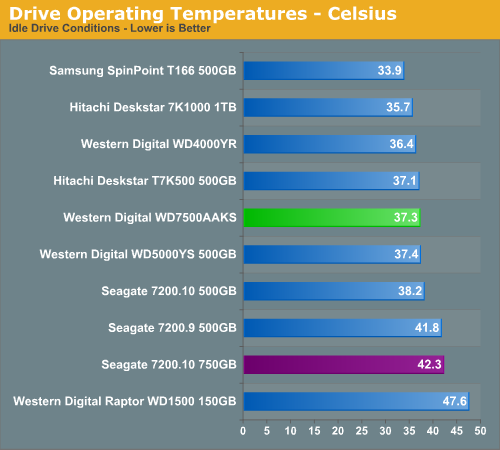
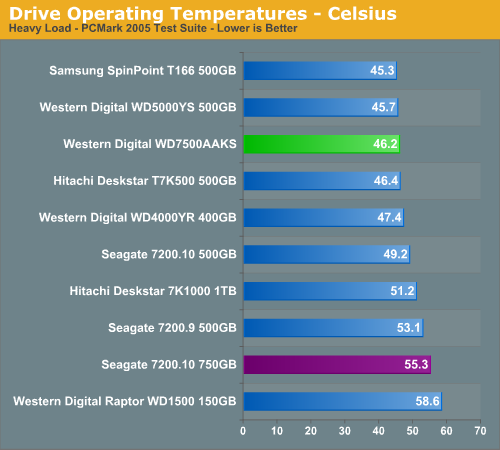
At 37.2C idle, the WD7500AAKS ends up in the middle of the pack. The situation improves dramatically, however, when the drive is under heavy load, coming in at an impressive 46.2C. This score is currently bested only by the Samsung T166 and the WD7500AAKS's smaller sibling, the 500GB WD5000YS. Keep in mind that larger drives with more platters usually generate more heat, so the temperature result is all the more impressive.
PCMark05
We are utilizing the HDD test suite within PCMark05 for further comparative hard disk scores as it provides a mixture of actual application results and specific read/write percentages utilized within these programs. The program utilizes the RankDisk application within the Intel iPEAK SPT suite of tools to record a trace of disk activity during usage of real world applications. These traces are then replayed to generate performance measurements based upon the actual disk operations within each application. The HDD test suite contains 53% read and 47% write operations with each trace section utilizing varied amounts of read or write operations. Additional information about the test suite can be found in PDF format in the PCMark05 whitepaper.
Our test results are based upon the following trace runs:
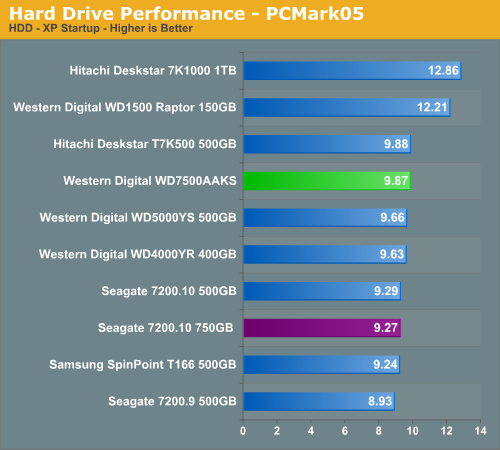
Windows XP Startup: This test consists of 90% reading and 10% writes that tracks XP activities at start-up.
Application Loading: This test consists of 83% reading and 17% writes that tracks the opening and closing of the following programs.
- Microsoft Word
- Adobe Acrobat Reader
- Windows Media Player
- 3Dmark 2001SE
- Leadtek WinFast DVD
- Mozilla Internet Browser
- Opening a Microsoft Word document, performing grammar check, saving and closing.
- Compression and decompression using WinZip
- Encrypting and decrypting a file using PowerCrypt
- Scanning files for viruses using F-Secure Antivirus
- Playing an MP3 file with Winamp
- Playing a WAV file with Winamp
- Playing a DivX video using DivX codec and Windows Media Player
- Playing a WMV video file using Windows Media Player
- Viewing pictures using Windows Picture Viewer
- Browsing the Internet using Microsoft Internet Explorer
- Loading, playing and exiting a game with Tom Clancy's Ghost Recon
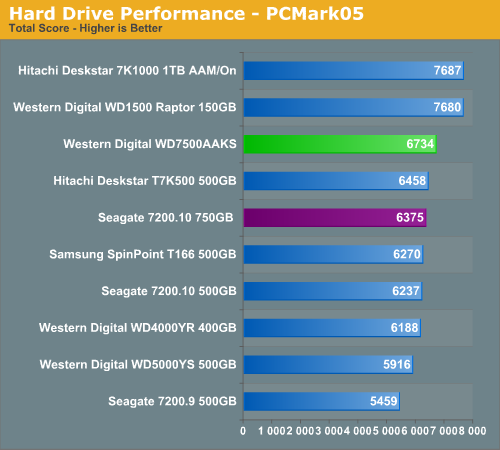
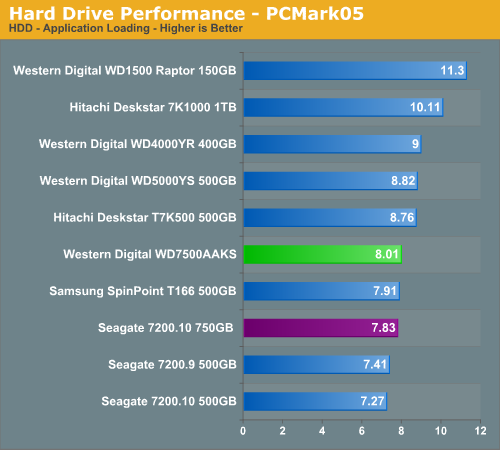
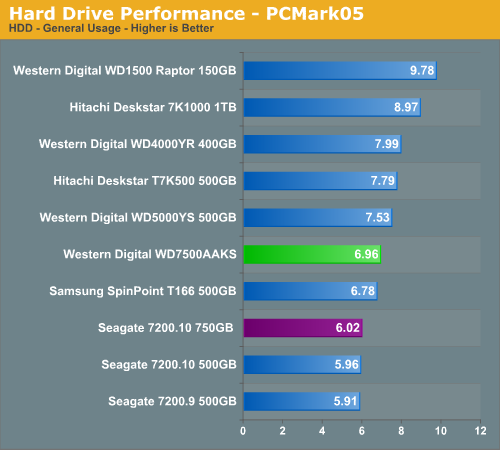
The WD7500AAKS's score of 6704 puts it squarely in third place once again, being bested only by the WD Raptor and the Hitachi 7K1000. Of note, the drive is nearly 8% quicker in the PCMark05 test than its 750GB competition from Seagate.
iPEAK Business Application Tests
Our iPEAK Winstone benchmarks offer a glimpse into how well our hard disk drives will handle general office applications, media encoding, and graphics manipulation. While the business applications that are being tested tend to be more CPU bound, the performance of the hard drive can and will make a difference in the more disk intensive video and graphics applications where large media files are typically being edited.
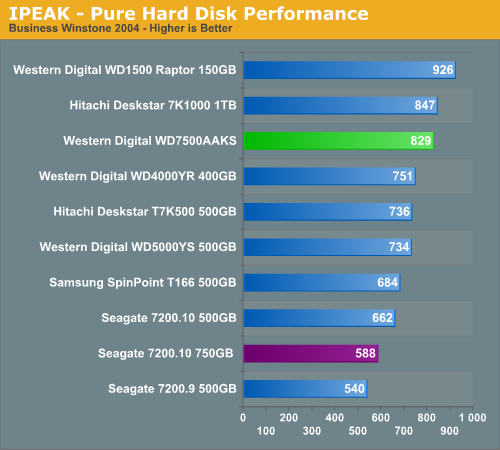
As expected, the Raptor drive continues its dominance in our benchmarks, but the WD7500AAKS turns in a very solid showing. Its Business Winstone score of 829 is slightly slower than the Hitachi 7K1000, but significantly faster than the Seagate 7200.10 750GB drive or any of the other 500GB drives we've tested.
iPEAK General Task Tests
The iPEAK based General Task benchmarks are designed to replicate utility based applications that typically are disk intensive and represent common programs utilized on the majority of personal computers. While the WinRAR program is very CPU intensive it will typically stress the storage system in short bursts. Our antivirus benchmark will stress the storage system with continual reads and sporadic write requests while the defragmentation process is split between continual read and write requests.
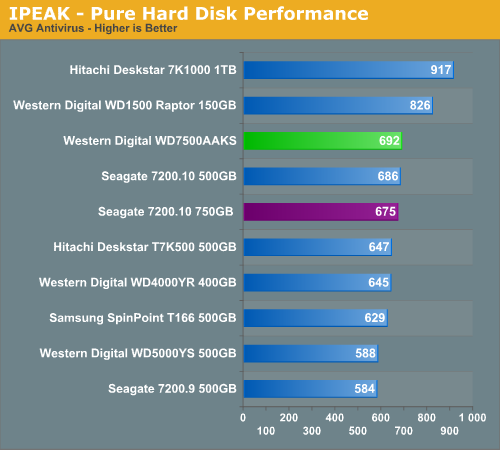
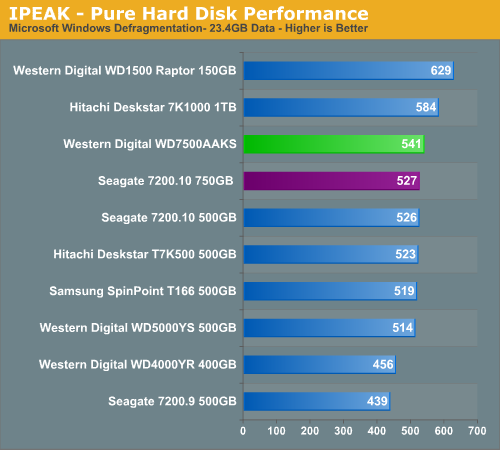

The WD 750GB performs consistently in third place in our benchmarks, producing results which are behind only the WD Raptor drive (hardly a fair comparison) and the other performance king, the Hitachi 7K1000. The only other 750GB drive tested (the Seagate 7200.10) is bested consistently by the WD7500AAKS.
Note that the WD7500AAKS does fall behind in the AVG Antivirus testing portion of this suite, coming in at a level close to the 7200.10 drive from Seagate. This is a significant improvement over previous WD SE series drives and indicates Western Digital has finely tuned their firmware for small block sizes of data in sequential order.
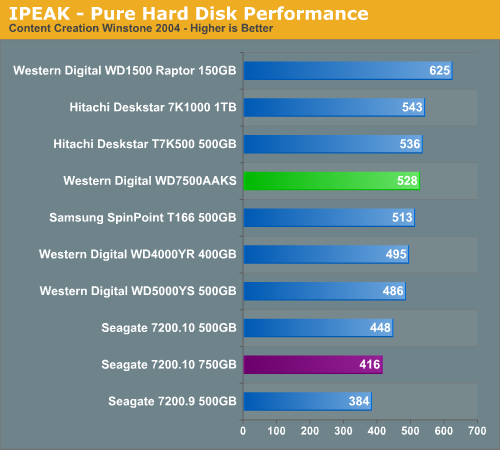
iPEAK Video/Audio Tests
The iPEAK based Video/Audio benchmarks are designed around simulating media encoding and HTPC activities. These benchmarks are CPU intensive in nature but also require a balanced storage system with the ability to handle read and write requests simultaneously in a very efficient manner. Using iPEAK also effectively removes the CPU from the equation, allowing us to focus on the hard drives.
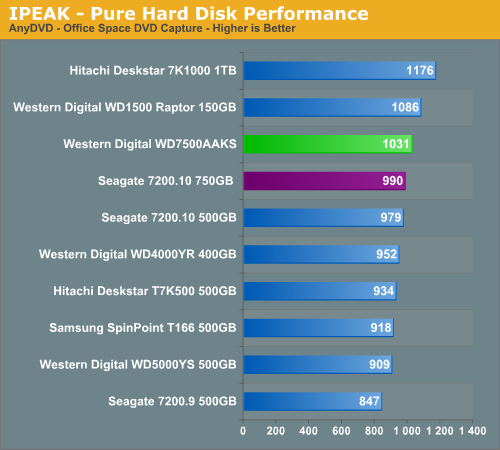
The AnyDVD benchmark is heavily weighted to sequential write requests with the PMR based drives generally finishing ahead of the other 7200RPM drives. The Western Digital drive beats the Seagate 7200.10 in this benchmark by nearly 4%, and even comes close to the vaunted Raptor. All non-PMR drives in the benchmark fall further behind the WD7500AAKS, generally moving well into the double-digit percentage differences. (Higher data density means faster transfer rates, which is part of the reason the PMR drives do so well.)
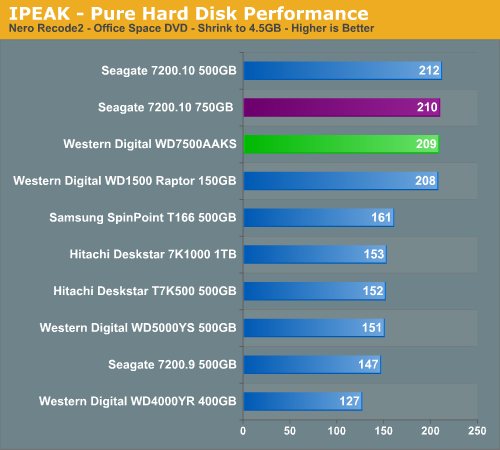
The Nero Recode 2 benchmark is weighted to streaming read requests but is balanced by continuous write operations near the end of the test. In this assessment, the Seagate 7200.10 edges out the WD7500AAKS slightly, which in turn comes in slightly ahead of the WD Raptor. Other non-PMR disks fall far behind in this benchmark. Realistically, the three drives at the top of this chart can be considered equal in this kind of task given the modest numerical difference in scores between each drive.
iPEAK Game Installation Tests
Our iPEAK based Game Installation benchmarks simply show the ability of the hard drive to write data as quickly as possible to the disc based upon the installation software instructions. As detailed in our iPEAK setup description we installed the games from our source drive in order to eliminate the optical drive bottleneck. In separate application timing we witnessed basically the same percentage spread when installing the games via our DVD drive so these results are representative of actual installation performance.
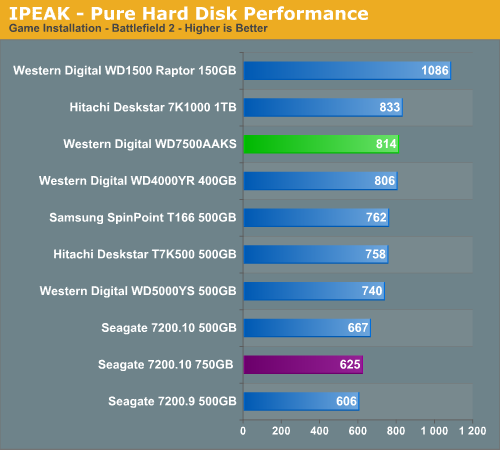
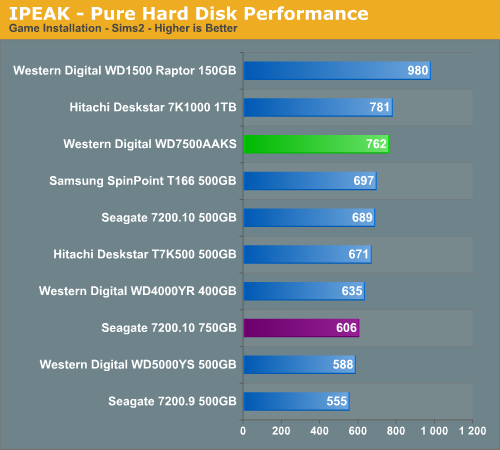
The Raptors, as expected, dominates our gaming tests due to their rotational and random access speed advantages. The WD7500AAKS turns in third-place finishes in both of these tests, behind the speedy Hitachi 7K1000 drive and lightning fast Raptors. Of note, the difference in performance between Western Digital's 750GB offering and Seagate's 7200.10 750GB drive is roughly 15% in each case.
iPEAK Game Play Tests
The iPEAK based Game Play tests are centered on the benefits of having a hard disk that can load non-linear or sequential data files quickly without interrupting the flow of the game.
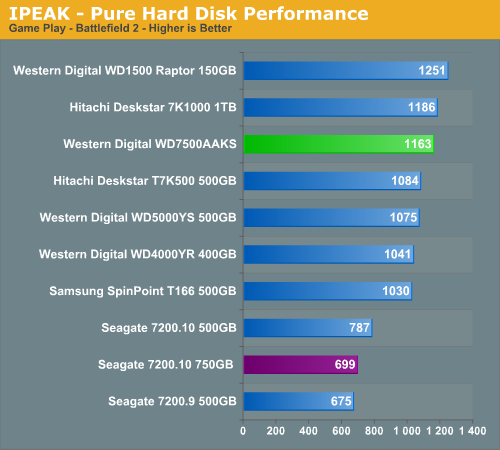
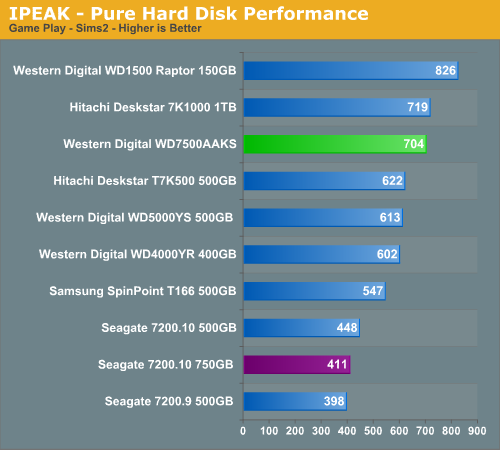
In a virtual copy of the results from the iPEAK Game Installation tests, the Western Digital WD7500AAKS comes in third, behind the Raptor and the Hitachi 7K1000. The difference between the Western Digital drive and the Seagate 750GB drive has become a chasm, benchmarking at a roughly 35% differential.
We need to remember our iPEAK tests reflect pure hard drive performance and will be mitigated by the system platform components as we will see in our application tests.
Actual Application Performance
Our application benchmarks are designed to show application performance results with times being reported in seconds, lower scores thus being better. While these tests will show some differences between the drives it is important to understand we are no longer measuring the pure performance of the hard drive but how well our platform performs with each individual drive. The performance of a hard drive is an integral part of the computer platform but other factors such as memory, CPU, core logic, and even driver choice can play a major role in determining how well the hard drive performs in any given task.
Game Load Test
Our Sims 2: Open for Business test measures the time it takes to load the initial portion of the game. Our application timer starts when the game icon is initiated until the neighborhood menu appears.
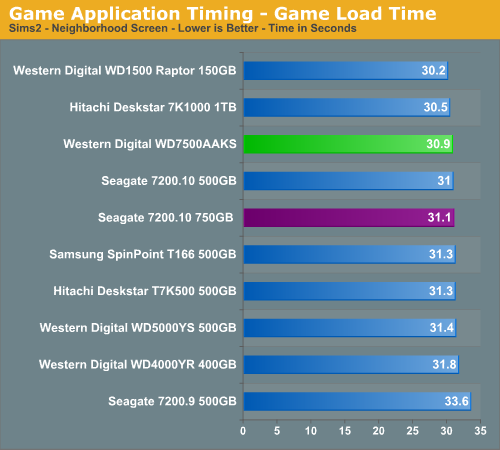
In this example of a real-world test, we can see that the differential between the fastest and slowest hard drives in our benchmarks has become considerably smaller. The Raptor and Hitachi continue to place first and second respectively, though the Western Digital WD7500AAKS now turns in numbers within a fraction of a second of those drives. Of note, the Seagate 7200.10 is still bested by the WD7500AAKS, but the real-world performance levels between the two drives (like those of the other drives) are significantly closer.
Game Level Load
This test centers on the actual loading of a playable level within our game selection. The Battlefield 2 test measures the time it takes to load the Daqing Oilfields level. Our application timer begins when the start single player icon is initiated and ends when the join game icon is visible.
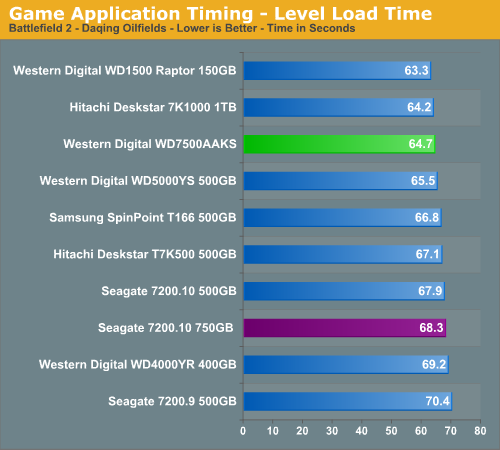
Continuing the real world example from above, the differential in level load times between the top performer (the Raptor) and the Western Digital WD7500AAKS is only one second (or 1.5 percent). From a price-performance standpoint, this speaks volumes, as the Raptor carries a price premium of $1.01 per GB of storage more than the WD7500AAKS. The Seagate 750GB drive is about 5% slower than our review drive in this test.
AnyDVD 6.1
Our next test has us utilizing the "ripping" function of AnyDVD to copy the Office Space DVD file from our source drive to our test drive. Our DVD features 29 files totaling 7.55GB of data and is an excellent test for determining the write speed of a drive.
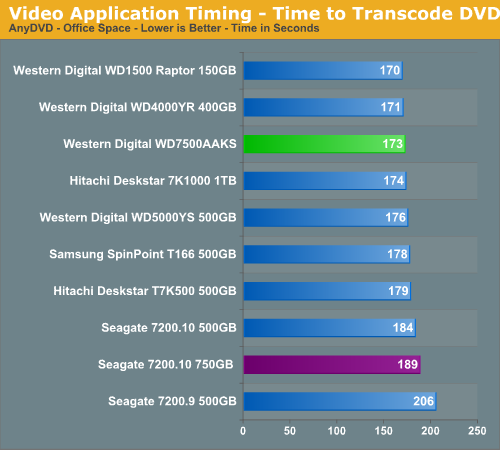
Western Digital drives extend their dominance in this benchmark, taking three out of the top four slots in our chart. The WD7500AAKS comes in slightly ahead of the Hitachi 1TB drive for the first time in the real-world benchmarks, and handily trounces the Seagate 750GB drive.
Nero Audio Encode
Our last test has us utilizing the audio encoding functions of Nero to convert our INXS Greatest Hits audio files in MP4 format to a high quality variable rate MP3 file for our portable player. Our test features 16 files totaling 137MB of data and is an excellent test for determining the read and write speed of a drive.
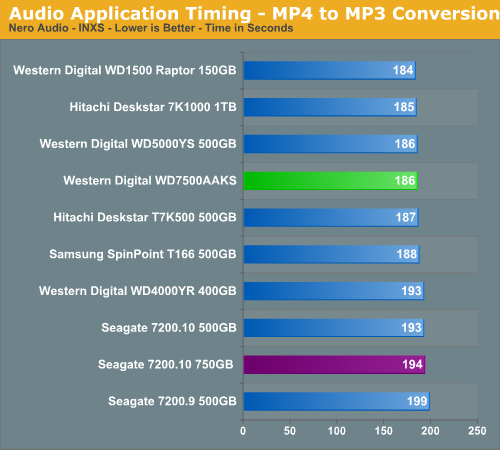
The Hitachi 1TB manages to climb back above the Western Digital drive in this test, though the WD7500AAKS maintains its third-place position. The Seagate 750GB is once again handily defeated by the Western Digital drive, though the differential shrinks when the test shifts from a "mainly write" benchmark (as in the AnyDVD test) to a read-write combination test like this one.
Quick Take
The Western Digital WD7500AAKS is a very solid entry by WD into an extremely competitive marketplace. Its performance is near the top of the charts in all benchmarks we ran in our labs, and WD's recent decision to grant the retail SE16 drive series a 3 year warranty removes one of the major issues surrounding this line of drives.
Improving the overall picture of this drive is the remarkably low power consumption it is able to boast at load conditions, although idle power consumption is average for this class. Western Digital has put together a very attractive package in this drive, particularly for situations where power consumption is a factor for systems running at load or near load conditions the majority of time. When comparing this drive to others in its class (for example, the Seagate 750GB 7200.10), the Western Digital WD7500AAKS's 10.7W power draw is nearly 25% less.
The WD7500AAKS scored some of the highest marks we've ever seen on some of the synthetic tests in the general desktop product sector. While the synthetic portion of the benchmarks are of arguably less value than the real world tests, the fact that this drive scores as well as it does gives it additional bragging rights in a market becoming increasingly crowded with similarly-performing hardware.
Real-world performance of the drive was excellent as well. We expected the Raptor to trounce the WD7500AAKS in all benchmarks, but we didn't expect the large differential between this drive and the Seagate drive. Considering these two drives are targeted at the same market space, Western Digital has a clearly superior product this time around. The iPEAK gaming performance in particular was an area where the WD7500AAKS excelled, often approaching (and occasionally beating) the WD Raptor due to excellent sustained transfer rates.
The drive's thermal performance, while nothing to boast about, is certainly above average, particularly given the capacity. The idle temperature of the drive sat squarely in the middle of our tests, but the drive truly shines with its fully-loaded heat increase of only 12%. This made it the coolest 750GB drive we've tested by a wide margin, and even gave the Samsung T166 (our current thermal champion) a run for its money. Noise, too, was a pleasant area of surprise for this drive, making this a suitable offering for even a HTPC setup.
In closing, the Western Digital WD7500AAKS offers strong performance, runs quietly, and emits relatively low amounts of heat. With a warranty that now mirrors that offered by most other manufacturers (except for Seagate, which boasts a full 5 year warranty), the drive can be recommended for virtually anyone looking to buy a drive in this price range. Western Digital has come a long way with its SE16 series, and this drive is an example that shines above its 750GB brethren.


