Original Link: https://www.anandtech.com/show/2866
Seagate Barracuda XT 2TB: SATA 6Gb/s Performance Preview
by Gary Key on October 29, 2009 12:00 AM EST- Posted in
- Storage
Seagate has finally started shipping their new Barracuda XT 2TB drives that feature the new 6Gb/s SATA interface based on SATA Revision 3.x specifications. We had an early preview of the drive a few weeks ago and finally received a production level item for review. Just as important, we now have retail motherboards from Asus and Gigabyte featuring 6Gb/s capabilities. Well at least the Marvell 88SE9123 chipset included on both motherboards is theoretically capable of 6Gb/s operation.
Asus and Gigabyte took a different approach to implementing the Marvell 9123 chipset on their motherboards. Asus’s top of the line P7P55D Premium (a very good board by the way, full review coming shortly) features a PEX PLX8613 PCIe bridge chip that will convert four of the P55’s PCIe x1 lanes (250MB/s each) into two 500MB/s lanes. While still short of the maximum theoretical 600MB/s transfer speed of the SATA 6G specifications, it will provide more than enough burst bandwidth for the first generation 6G hard drives. The benefit is that the 6G capability is always on without affecting the other capabilities of the board and the same PLX chipset will be utilized for the upcoming USB 3.0 (NEC chipset) option on their upper-end boards.
Gigabyte’s implementation will be utilizing an x8 PCIe 2.0 from the Lynnfield processor that will obviously provide more than enough bandwidth but the drawback is that CF/SLI capabilities will be disabled as only a single x8 PCIe 2.0 lane will be available to the GPU. The benefit in this approach is that the SATA 6G switch is disabled/enabled in the BIOS by the user based upon need. Since an additional hardware chipset like Asus is utilizing is not required, it should result in a slightly lower board cost. Gigabyte informed us this week that all P55A-xxx boards will feature both SATA 6G and USB 3.0 capabilities. We will compare the performance of Gigabyte’s solution against Asus’ implementation shortly.
For today’s preview we are utilizing the Asus P7P55D Premium motherboard, 8GB of GSkill’s DDR3-1600 Ripjaw memory, Asus HD5870 video card, Corsair 750HX power supply, Windows 7 x64 RTM, Western Digital Caviar Black 2TB HD, WD VelociRaptor 300GB, Intel X25-M G2 160GB SSD, and Seagate’s Barracuda XT 2TB HD. We will have a full review of both hard drives shortly with additional performance results along with temperature and noise tests.
We are utilizing the Intel 160GB SSD for our OS drive and comparing the Seagate XT drive to its closest competitor, the WD Caviar Black, on both the Intel P55 and Marvell 9123 controllers. The P55 is limited to SATA 3Gb/s operational mode when running either drive, while the Marvell controller will be operated in SATA 6Gb/s mode with the Seagate drive and in fallback 3Gb/s mode with the WD drive. We are utilizing Marvell’s latest 1027 driver and Intel’s 7.0.0.1013 driver set in AHCI mode.
HD Tune 3.50 Results -
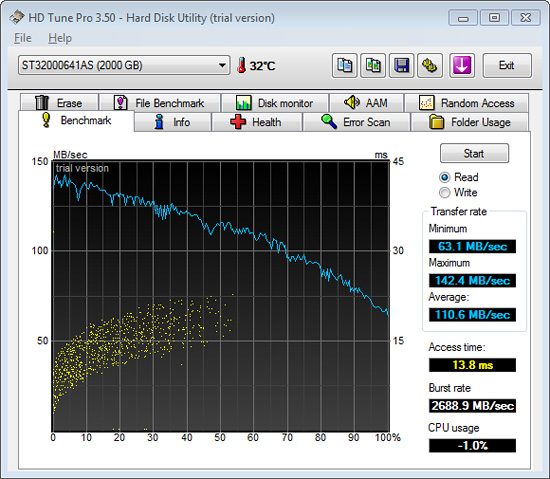
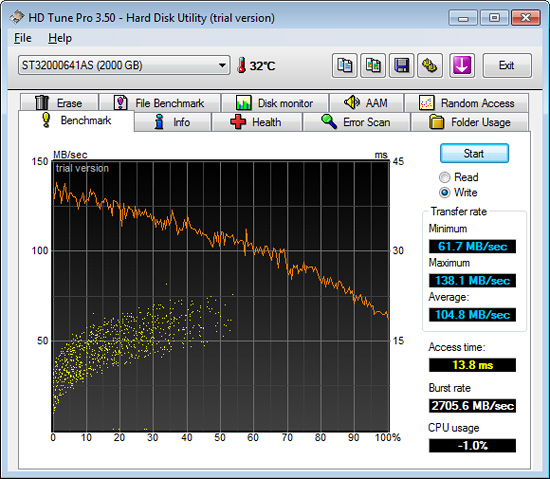
See something strange, the read burst rate of 2766MB/s and write burst of 2705MB/s are incredible for single drive performance but like most synthetic test results, they are not a true indication of actual platform performance. The reason for these “outstanding” results is that Marvell’s latest driver allocates (dynamically) a portion of system memory for transfer cache operations. Intel’s own Matrix Storage Manager and JMicron’s latest driver set also utilize a similar approach. In fact, Windows 7 implements a similar type of caching at the kernel level that makes these driver optimizations redundant in some ways.
Marvell is using aggressive algorithms in this particular driver to read and write as much possible data out of the RAM cache as possible before relying on transfers via the hard drive’s own internal cache or reading/writing from the platter or NAND. In earlier driver sets from Marvell, they requested that Window’s write-cache buffer flushing option be disabled in order to gain the maximum benefit from the 9128 controller. From all indications, the 1027 driver automatically disables this function as our performance results were the same with it disabled or enabled.
While performance was generally up to 10% better with this driver compared to the earlier 1018/1025 driver sets, we have a problem with the write-cache buffer flush being disabled automatically. There is a potential for data loss or even file table corruption if the buffers are not flushed and written properly if power is lost or there is another problem with the system. Of course that potential problem even exists with the out of box drivers and with write-caching enabled.
Our concern is that the Marvell driver might not recognize file table priorities in the same manner that the kernel does and those journal entries will be placed into the same general cache queue with other mundane requests. That could increase the likelihood of data or table corruptions above the normal risk posed with write caching. We are still waiting on additional information about the driver design and will update our findings in the final review.
AnandTech Storage Bench Results –
Finding good, real world, storage benchmarks is next to impossible. The synthetic tests work up to a certain point but you need real world examples. Measuring performance in individual applications often ends up with charts like these where all of the drives perform identically. Benchmark suites like PCMark Vantage are the best we can do, but they are a bit too easy on these drives in my opinion and while representative of a real world environment, they aren’t necessarily representative of all real world environments.
Recently we’ve been able to get our hands on a piece of software that allows us to record all disk activity on a machine and then play it back on any other machine. The point is that we can now model a real world usage scenario without waiting for BAPCo or Futuremark to do it for us. The performance results are reported in I/O Operations per Second (IOPS).
The first in our new benchmark suite is a light usage application case. The Windows 7 system is loaded with Firefox, Office 2007 and Adobe Reader among other applications. With Firefox we browse web pages like Facebook, AnandTech, Digg and other sites. Outlook is also running and we use it to check emails, create and send a message with a PDF attachment. Adobe Reader is used to view some PDFs. Excel 2007 is used to create a spreadsheet, graphs and save the document. The same goes for Word 2007. We open and step through a presentation in PowerPoint 2007 received as an email attachment before saving it to the desktop. Finally we watch a bit of a Firefly episode in Windows Media Player 11.
There’s some level of multitasking going on here but it’s not unreasonable by any means. Generally the application tasks proceed linearly, with the exception of things like web browsing which may happen in between one of the other tasks.
The recording is played back on all of our drives here today. Remember that we’re isolating disk performance; all we’re doing is playing back every single disk access that happened in that ~5 minute period of usage. The light trace is composed of 37,501 reads and 20,268 writes. Over 30% of the IOs are 4KB, 11% are 16KB, 22% are 32KB and approximately 13% are 64KB in size. Less than 30% of the operations are absolutely sequential in nature. Average queue depth is 6.09 IOs.
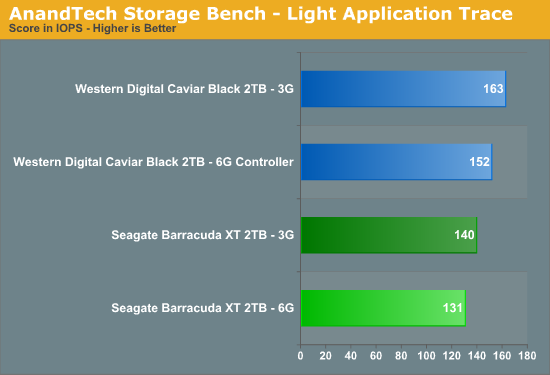
The Marvell controller is 7% slower than the Intel controller with the WD drive and once again 7% with the Seagate drive. The WD drive is up to 24% faster than the Seagate drive depending on the controller configuration.
If there’s a light usage case there’s bound to be a heavy one. In this test we have Microsoft Security Essentials running in the background with real time virus scanning enabled. We also perform a quick scan in the middle of the test. Firefox, Outlook, Excel, Word and Powerpoint are all used the same as they were in the light test. We add Photoshop CS4 to the mix, opening a bunch of 12MP images, editing them, then saving them as highly compressed JPGs for web publishing. Windows 7’s picture viewer is used to view a bunch of pictures on the hard drive.
We then use 7-zip to create and extract .7z archives. Downloading is also prominently featured in our heavy test; we download large files from the Internet during portions of the benchmark, as well as use uTorrent to grab a couple of torrents. Some of the applications in use are installed during the benchmark, Windows updates are also installed. Towards the end of the test we launch World of Warcraft, play for a few minutes, then delete the folder. This test also takes into account all of the disk accesses that happen while the OS is booting.
The benchmark is 22 minutes long and it consists of 128,895 read operations and 72,411 write operations. Roughly 44% of all IOs were sequential. Approximately 30% of all accesses were 4KB in size, 12% were 16KB in size, 14% were 32KB and 20% were 64KB. Average queue depth was 3.59.
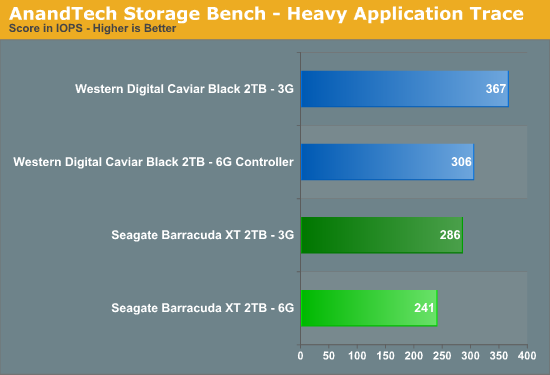
The Marvell controller is 19% slower than the Intel controller with the WD drive and 18% with the Seagate drive. The WD drive is up to 28% faster than the Seagate drive.
Our final test focuses on actual gameplay in four 3D games: World of Warcraft, Batman: Arkham Asylum, FarCry 2 and Risen, in that order. The games are launched and played, altogether for a total of just under 30 minutes. The benchmark measures game load time, level load time, disk accesses from saved games and normal data streaming during game play.
The gaming trace is made up of 75,206 read operations and only 4,592 write operations. Only 20% of the accesses are 4KB in size, nearly 40% are 64KB and 20% are 32KB. A whopping 69% of the IOs are sequential, meaning this is predominantly a sequential read benchmark. The average queue depth is 7.76 IOs.
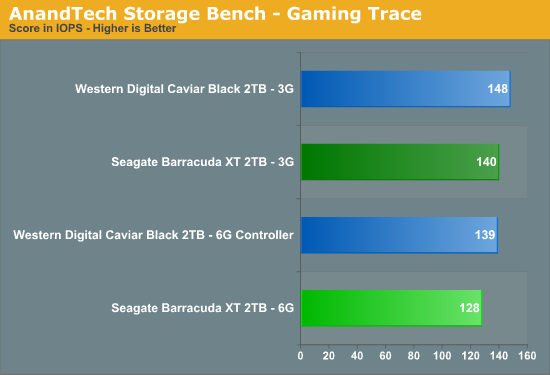
Not much else to say here, the Marvell controller is 6% slower than the Intel controller with the WD drive and 9% with the Seagate drive. The WD drive is up to 8% faster than the Seagate drive.
AnandTech Small Folder Transfer Results –
In our first storage test, we utilize a 3.82GB test folder and transfer it from our WD VelociRaptor drive to the competing hard drives.
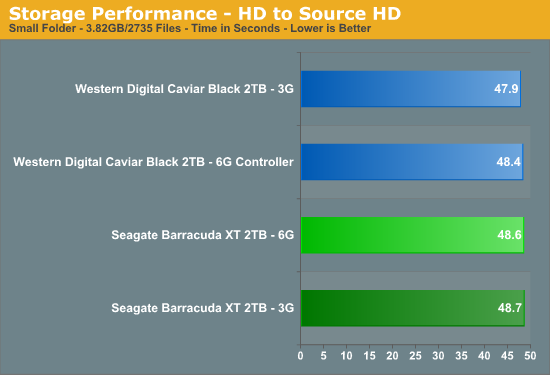
There is only a 2% difference in performance between the two drives on the Intel P55 controller and basically a tie on the Marvell controller. We did not expect anything really different as the average sustained transfer rates between all three drives are very close.
In our second storage test, we utilize the same 3.82GB test folder and transfer it from our test hard drives to the Intel 160GB SSD.
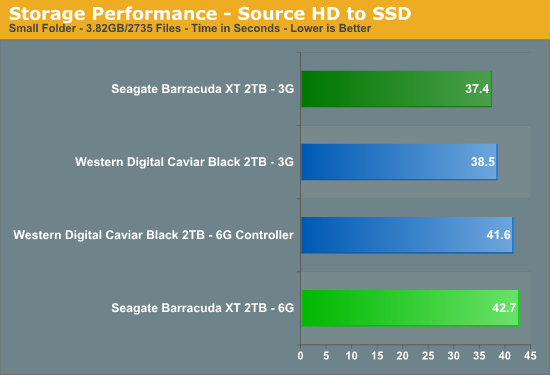
The tables flip here with the Seagate drive performing about 3% faster on the Intel controller than the WD drive. However, Seagate drive is 12% faster in this test on the Intel P55 in 3Gb/s mode than at 6Gb/s mode on the Marvell controller.
In our final small folder test, we utilize the 3.82GB test folder and transfer it from our test SSD back to the competing hard drives.
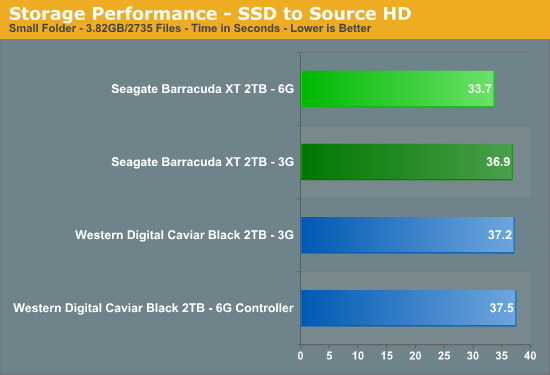
We finally see the Marvell 9128 chipset making a difference. The Seagate XT drive is 9% faster in 6Gb/s operation than in 3Gb/s mode on the Intel P55. We noticed peak transfer rates of 296MB/s on the Marvell controller compared to 262MB/s on the Intel controller with the Seagate drive. In both cases, the Seagate drive is faster in this test than the Western Digital drive.
AnandTech Large Folder Transfer Results –
In our first storage test, we utilize a 15.2GB test folder and transfer it from our WD VelociRaptor drive to the competing hard drives.
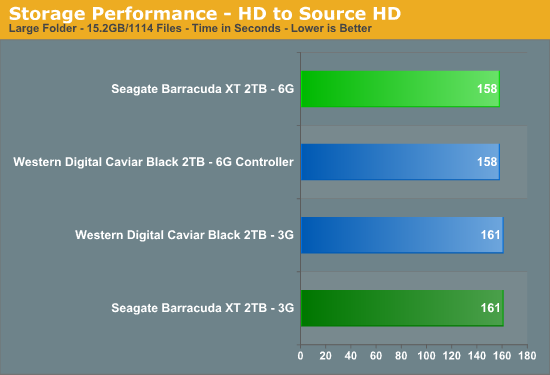
Our two drives perform identically on like controllers, the only difference here is that the Marvell controller is leading Intel in part to the aggressive 1027 driver algorithms that utilize additional system memory for transfer caching.
In our second storage test, we utilize the same 15.2GB test folder and transfer it from our test hard drives to the Intel 160GB SSD.
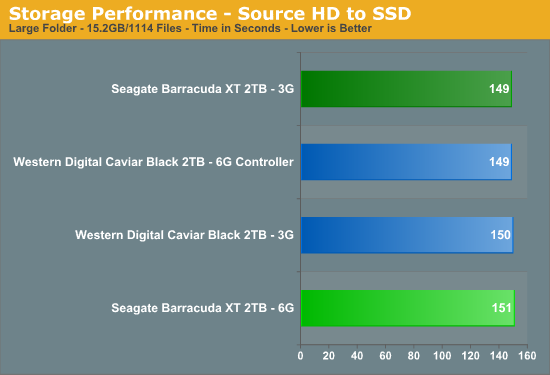
Interestingly enough, the WD drive is faster on the Marvell controller than the Intel. However, the Seagate drive benefits from the Intel controller.
In our final large folder transfer test, we utilize the 15.2GB folder and transfer it from our test SSD back to the competing hard drives.
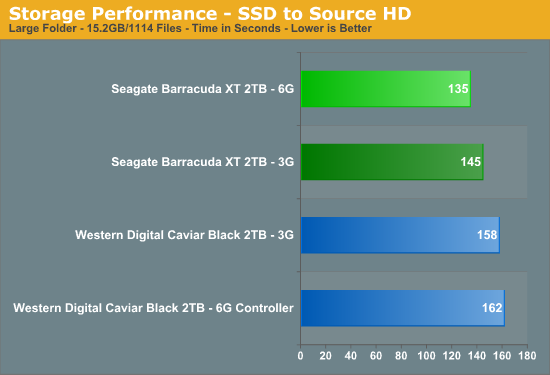
Like our small folder test, we see the benefits of the Marvell Controller in SATA 6Gb/s mode as the Seagate drive is 7% faster than it is in SATA 3Gb/s operation. The WD drive is up to 17% slower in this particular test.
PCMark Vantage x64 Results –
We are showing the total score for the PCMark Vantage disk benchmark as a reference point between the two controllers and drives.
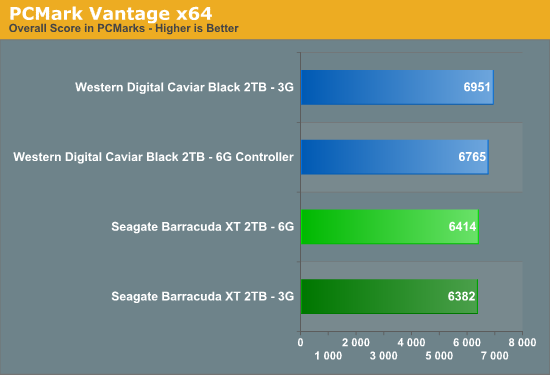
The Seagate XT drive in SATA 6Gb/s mode on the Marvell controller is barely faster than SATA 3Gb/s mode on the Intel controller. The WD drive is just flat out faster in this particular benchmark with the Intel controller being about 3% faster than the Marvell controller.
Quick Thoughts:
That was a letdown in several ways. We never really expected that much out of SATA 6Gb/s technology as our two hard drive samples are just now pushing the boundaries of SATA 1.5Gb/s. Only when we utilized a fast SSD as the source drive to copy files to the Seagate Barracuda XT did we see an advantage in the burst rates available on it and the Marvell 9123 chipset. Even then, the advantage was fleeting as the sustained transfer rates equalized quickly between the two controllers. This test is just the opposite of what a typical user would perform anyway as most would utilize the hard drive for storage purposes and not the SSD.
Even more disturbing was the performance disparity between the Seagate Barracuda XT 2TB and the Western Digital Caviar Black 2TB drive in our limited benchmark test suite. We expected more from the Seagate drive based on its specifications, not the 6Gb/s abilities but platter design and cache setups. Hopefully Seagate can improve performance with firmware changes, if not; the battle is already lost regardless of controller technology.
We just do not see SATA 6Gb/s technology offering any real benefits for spindle-based hard drives on the desktop at this time. Rotational speeds are being kept in check at 7,200rpm with all the performance improvements coming from increased areal densities and cache. We expect SATA 6Gb/s to really come into its own with solid state drives. This will not occur quickly but we expect to see recognizable benefits with controller designs about two generations ahead of where we are currently. By that time, both AMD and Intel will have native 6Gb/s capabilities on their controller hubs.
In the meantime, we see the current implementations of 6Gb/s technology on motherboards as being a marketing checklist feature for the most part. However, since the Marvell 9123 chipset can fall back to SATA 3Gb/s or 1.5Gb/s operational mode it does offer additional SATA ports on the motherboard with performance that is fine for secondary storage devices.


